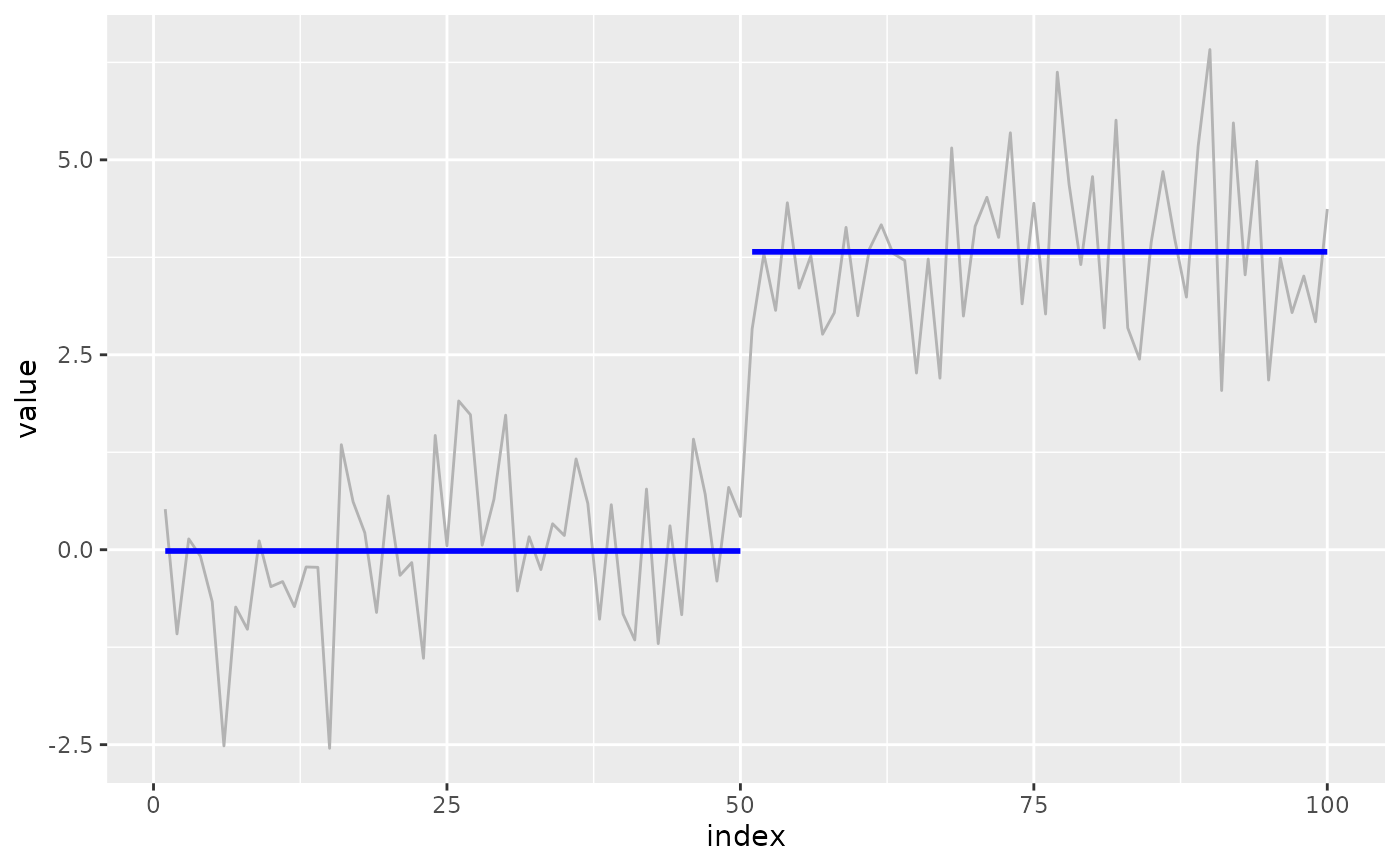
Draws horizontal segments representing the estimated level of each segment
between changepoints. Typically used with data from augment().
See also
Other ggplot2 layers:
geom_changepoint(),
geom_cpt_ci(),
geom_cpt_event(),
geom_cpt_label(),
geom_cpt_region(),
ggchangepoint-ggproto,
stat_changepoint(),
stat_cpt_region()
Examples
library(ggplot2)
set.seed(2026)
fit <- cpt_detect(c(rnorm(50), rnorm(50, 4)), method = "pelt")
ggplot(fit$data, aes(index, value)) + geom_line(colour = "grey70") +
  geom_cpt_segment(aes(x = start, xend = end, y = param_estimate,
                       yend = param_estimate),
                   data = fit$segments, colour = "blue", linewidth = 1)