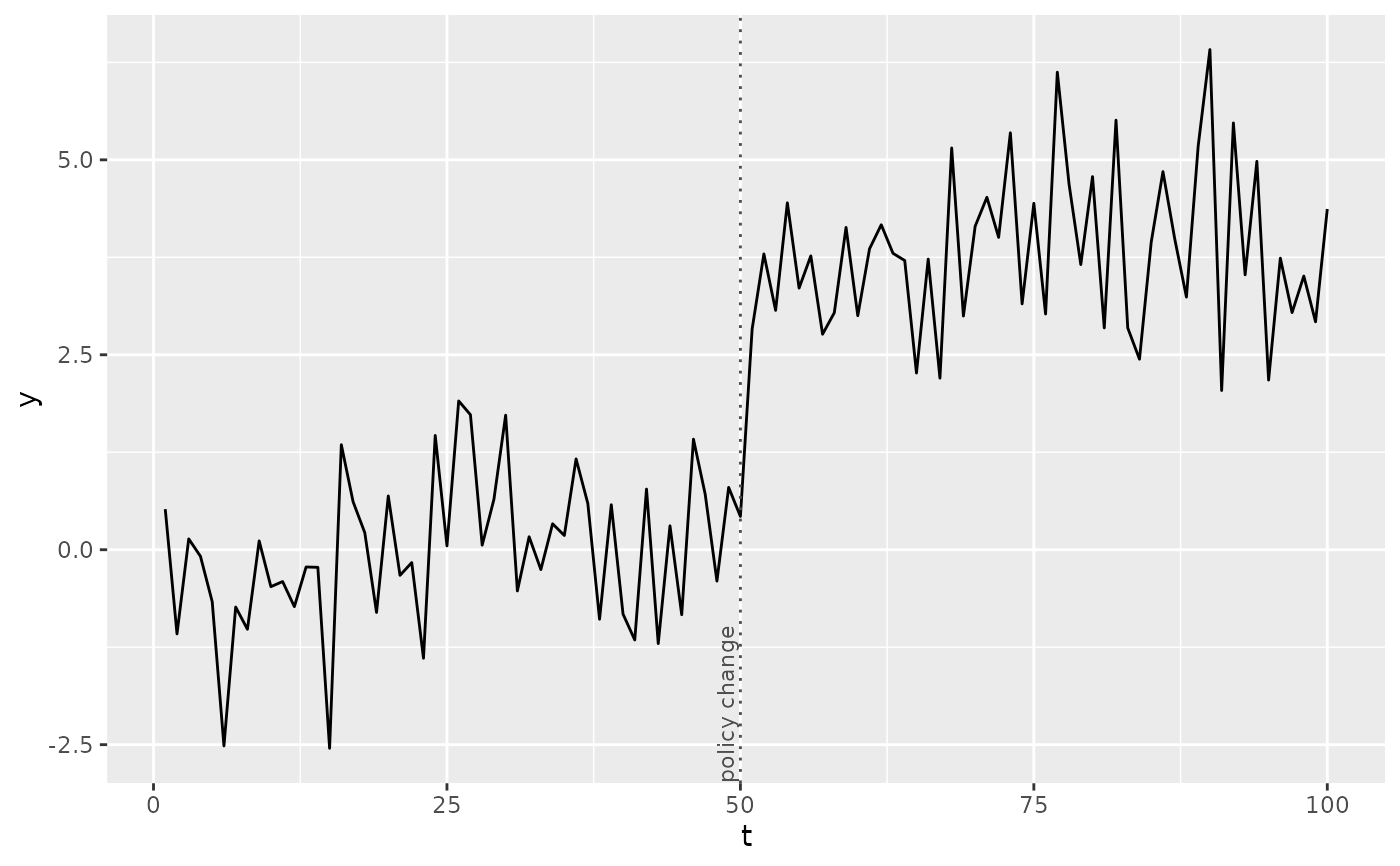
Marks known real-world events on a changepoint plot: a vertical rule plus
a text label. "Changepoint at index 147" is not a finding; "changepoint at
2020-03-11, matching the WHO pandemic declaration" is.
cpt_annotate_events() produces the frame this layer expects
and, crucially, also reports the changepoints no event explains and the
events no changepoint found.
Usage
geom_cpt_event(
  mapping = NULL,
  data = NULL,
  ...,
  colour = "grey30",
  linetype = "dotted",
  angle = 90,
  size = 3,
  vjust = -0.4,
  hjust = 0,
  repel = NULL,
  inherit.aes = FALSE,
  na.rm = FALSE
)
Arguments
- mapping
Aesthetic mappings. Requires
xinterceptfor the rule andlabelfor the text.- data
A data frame of events (see
cpt_annotate_events()).- ...
Other arguments passed to the text layer.
- colour
Rule and text colour. Defaults to
"grey30".- linetype
Rule linetype. Defaults to
"dotted".- angle
Text angle in degrees. Defaults to
90, because event labels are usually longer than the space between events.- size
Text size. Defaults to
3.- vjust, hjust
Text justification.
- repel
Use ggrepel to keep labels from overlapping? Defaults to
TRUEwhen the package is installed. Requiresyto be mapped as well (ggrepel places text, it cannot infer a height).- inherit.aes
Whether the label layer inherits the plot's aesthetics. Defaults to
FALSE: an event table has its own columns, and inheriting the series'x/ymapping would look for columns that are not there.- na.rm
If
FALSE, missing values are removed with a warning.
Value
A list of two ggplot layers (a rule and a label), which can be added to a plot exactly like a single layer.