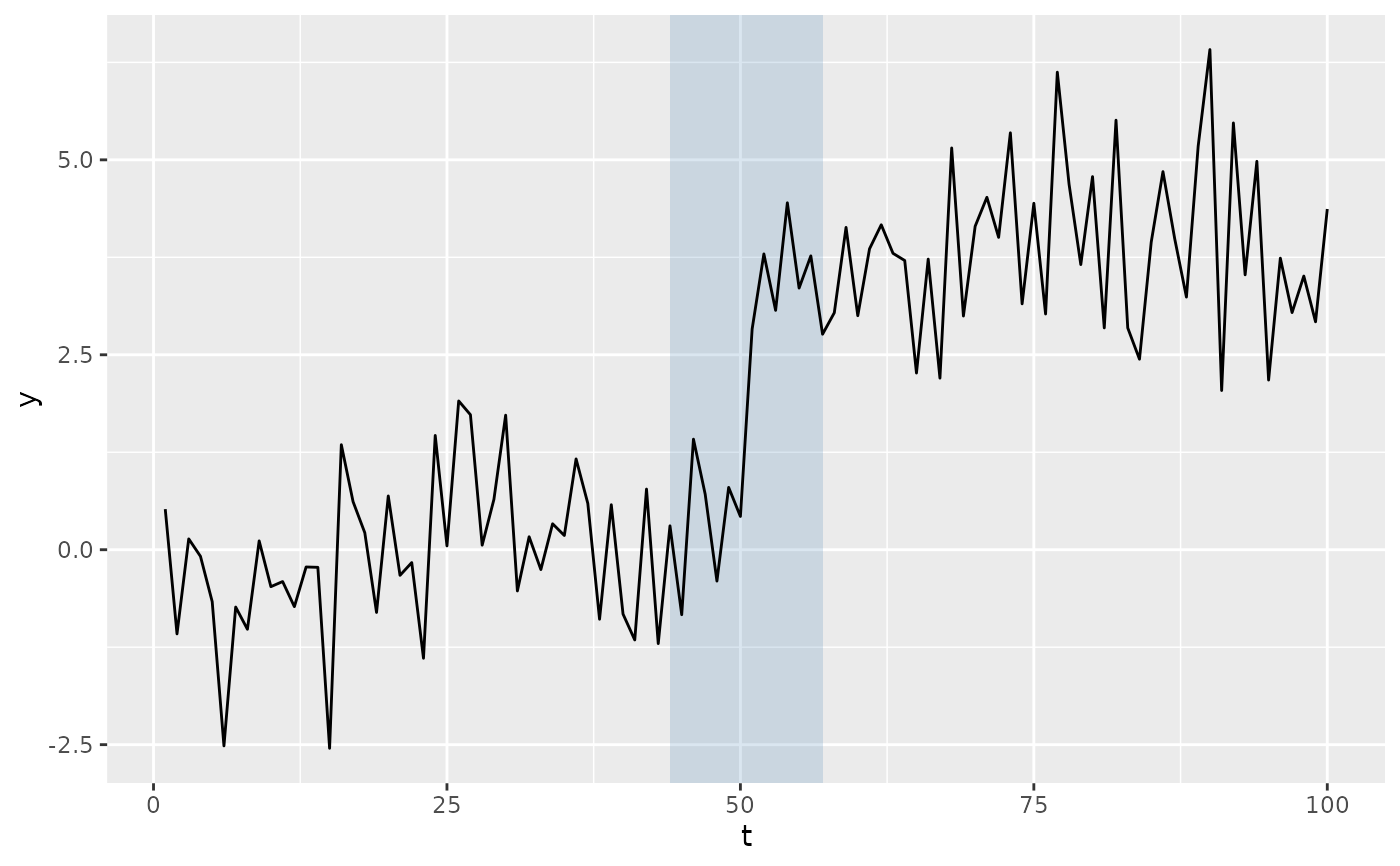
Draws a changepoint that is an interval: a vertical band spanning
xmin to xmax and the full height of the panel. This is the
display Narrowest Significance Pursuit needs
(nsp_wrapper()): NSP returns intervals each of which
contains at least one changepoint at a prescribed global
significance level, which is neither a point estimate nor a confidence
interval around one. autoplot() adds this layer automatically for
a result that carries regions.
Usage
geom_cpt_region(
  mapping = NULL,
  data = NULL,
  ...,
  alpha = 0.2,
  fill = "steelblue",
  na.rm = FALSE,
  show.legend = NA,
  inherit.aes = FALSE
)
Arguments
- mapping
Aesthetic mappings. Requires
xminandxmax;ymin/ymaxdefault to the panel extent, so they need not be supplied.- data
A data frame of regions, e.g.
cpt_regions()output.- ...
Other arguments passed to
ggplot2::geom_rect().- alpha
Fill transparency. Defaults to
0.2: light enough that the series stays readable through overlapping bands.- fill
Band fill colour. Defaults to
"steelblue".- na.rm
If
FALSE, missing values are removed with a warning.- show.legend
Whether to show a legend.
- inherit.aes
Whether to inherit the plot's aesthetics. Defaults to
FALSE: a region frame has its own columns and nothing to do with the series'x/y.