
Runs a changepoint detection method on a sequence and returns a tidy
ggcpt result object. This is the recommended entry point for most
users. See cpt_methods() for the full method table with
engines and capabilities.
Usage
cpt_detect(
  x,
  method = "pelt",
  change_in = "mean",
  penalty = "MBIC",
  index = NULL,
  y = NULL,
  ...,
  data = NULL,
  family = NULL,
  group = NULL,
  na_action = c("error", "omit", "engine"),
  fixed = NULL,
  within = NULL,
  min_segment = NULL,
  min_effect = NULL,
  keep_fit = TRUE
)
Arguments
- x
The series. A numeric vector for univariate methods, or a numeric matrix/data frame (rows are time points) for the multivariate methods (run
subset(cpt_methods(), multivariate)$methodfor the list). Ats,xts,zooortsibbleis accepted directly and its time index is carried through totidy()andautoplot(); so is a data frame together withy(and optionallyindex).Also a formula with
data:y ~ x1 + x2fits breakpoints in a regression (methods"strucchange","segmented"and"fastcpd"; seecpt_methods()'sformulacolumn), andy ~ 1is the response alone, which every univariate method takes.Several series at once: a dplyr-grouped data frame, a keyed
tsibble, or a long data frame withgroupnaming the column(s) that identify each series. Each group is detected separately and the answer is acpt_batch()result carrying the grouping columns.Refused rather than coerced: a factor (its level codes are not data), a survival object, and dates or timestamps as values (they convert to an increasing count; pass them as
index).- method
Detection method: any
methodincpt_methods()whosestatusis"available"or"registered". Methods whose engines live inSuggestsreport what to install when missing;cpt_register_method()adds detectors this package does not wrap.- change_in
What to detect change in. One of
"mean","var","meanvar","slope","distribution","covariance","network","regression"or"seasonality". Defaults to"mean". The requested value is validated against the method's capabilities (seecpt_methods()); incompatible combinations error rather than silently running something else.A compatible request may still be routed to the method's own native change type, because several engines have no separate estimator for the thing being asked about. That is never silent: the result's
change_inrecords what was actually detected, so compare it with what you asked for. Measured across every method and every value itssupportsentry lists, six pairs are routed:not's"var"becomes"meanvar"(its variance contrast is piecewise-constant in mean and variance),cpm's"mean"and"var"both become"distribution",kcp's become"running mean"and"running var", andwbsts's"mean"becomes"var"(it detects change in the wavelet spectrum). Every other listed combination returns the change type it was asked for.- penalty
Penalty type or value. Either a character string (
"MBIC","BIC","SIC","AIC","Hannan-Quinn","None") or a numeric penalty value. Defaults to"MBIC". See the penalty-semantics section ofcpt_penaltyfor how each engine interprets it; methods that use thresholds, significance levels, or posteriors instead of penalties ignore this argument, and"segneigh"falls back to"SIC"because changepoint does not implement MBIC for Segment Neighbourhood. Note also that the default"MBIC"is resolved to a numeric value for the numeric-penalty engines ("fpop","cpop","decafs"), and that value is stronger than those wrappers' own2 * log(n)default (19.9 against 11.8 at \(n = 360\)), socpt_detect(x, method = "decafs")can report fewer changepoints thandecafs_wrapper(x)on the same series. Passpenaltyexplicitly to make the two entry points agree.- index
Optional time index, one value per observation (dates, say). Detection still runs on observation positions (every wrapped engine assumes an equally spaced sequence), but the index is stored on the result and threaded through
tidy()(ascp_index),augment(),autoplot()andcpt_report(), so the output speaks in the user's own units. An index that is not equally spaced warns. Whenxis a data frame andyis given,indexselects a column of that data frame instead of being a vector.- y
Column selection for the data-frame interface:
cpt_detect(df, y = value, index = date, method = "pelt"). A bare column name, a string, or a column position. Only meaningful whenxis a data frame; a data frame passed withoutykeeps its 0.4.0 meaning (one column per coordinate).- ...
Additional arguments passed to the specific wrapper (see the wrapper's help page for engine-specific options). Where an argument is also derived from
change_in(not'scontrast,cpm'scpm_type,kcp'srunning_stat,sn'sparameter,fastcpd'sfamily), a value supplied here takes precedence. Check the spelling against the wrapper's help page: several engines end their own signature in...(wbs, not, Rbeast, strucchange, segmented, fastcpd, fChange, bfast), so for those a misspelt argument name is silently discarded upstream and the engine quietly uses its default rather than reporting the typo. Every other wired method rejects an unknown argument by name. A name that is a near miss of a real argument ofcpt_detect(), the wrapper or its engine (n_intervalforn_intervals) is refused with the suggestion, and a modelling-choice value outside the method's vocabulary (cpt_methods()$choices, e.g.test.stat = "Poison") is refused with the nearest valid value.seedis honoured by every method: passed to a wrapper that has one, and otherwise used to scope the random stream around the fit (restored afterwards);seed = NULLmeans unset.- data
A data frame for the formula interface.
- family
The distribution a segment is modelled with:
"gaussian","poisson","binomial","exponential","gamma","laplace"or"l1".NULL(the default) runs each method's own default, which for every parametric method is Gaussian. A single-parameter family changes in its rate or probability, so it is used withchange_in = "mean". Which methods fit which families, and the engine call each combination becomes, is incpt_families(); a combination not listed there is refused. The data are checked against the family (counts must be whole and non-negative, binary data 0/1, waiting times positive). fastcpd's and stepR's ownfamilyvalues ("ar","hsmuce", ...) still reach those engines.- group
For a long data frame holding several series, the column(s) identifying each one: a bare name, a string, or
c(a, b).- na_action
What to do with missing values:
"error"(the default) refuses them;"omit"drops them, detects on what is observed, and reports every location in the original positions (a changepoint lands on the last observed point of its left segment), keeping the gaps in$dataso plots show them and the translation in$diagnostics$na_omitted;"engine"passes them to an engine that handles them in place, which measured forbeastandsegmentedonly (seecpt_methods()$na_handling), and is refused for the rest. There is no"impute": imputing and then detecting pulls the estimated location towards the imputed stretch, by more the longer the gap.- fixed
Changepoints known in advance, which are kept and the rest estimated around them: the detector runs separately on each stretch between them. Positions, or values of the series' index (a date is placed at the last observation on or before it; for a numeric index such as a
ts's years, a number outside1..nis read as an index value and one inside as a position).- within
Windows the changepoints must fall in ("the policy took effect sometime in Q2"): a pair
c(start, end), a list of pairs, or a two-column table, in positions or index values; a bound beyond either end of the series is read as that end. The engine searches the whole series and changepoints outside every window are dropped (recorded in$constraints); it restricts what is reported rather than re-optimising.- min_segment
Minimum segment length in observations, translated into each engine's own argument (
minseglen,min_size,h,delta, ...:cpt_methods()$min_segmentnames it). A method without one refuses it. Whenmin_segmentis not given, the engines whose own default allows one-observation segments (the change-in-mean changepoint methods other than SegNeigh,npandbinsegrcpp) get a floor of two, so a short or monotone series is not split after every point.- min_effect
Drop changepoints whose mean shift is smaller than this many noise standard deviations (estimated from the series' first differences, which a changepoint barely moves), removing the smallest first and re-measuring its neighbours after each removal. For a change in mean only. The size is measured on the same data that located the change, so it is biased upward; see
cpt_effect().- keep_fit
Keep the engine's own object in
$fit? Defaults toTRUE. A few engines return objects far larger than the answer (a warning says so above 10 MB, once per method per session);FALSEdrops it, which only the engine-specific accessors notice. Everything else in the result is plain data, so a saved result reads back in any R session, with no packages installed.
Value
A ggcpt object: a list with changepoints
(cp, cp_value), segments (seg_id,
start, end, n, param_estimate),
data (index, value), the method,
change_in, penalty, cp_convention and
runtime that produced it, the matched call, and
fit, the raw upstream object. Optional slots
(data_wide, regions, diagnostics, ...) appear
only when an engine supplies them; new_ggcpt()
documents all of them, and tidy.ggcpt(),
glance.ggcpt() and augment.ggcpt()
are the supported way to read one.
Scale sensitivity of the penalised change-in-mean engines
"pelt", "binseg", "segneigh" and "fpop"
compare a penalty against a raw segment cost when
change_in = "mean": changepoint's Normal cost assumes a
noise standard deviation of 1, and fpop's lambda is an
absolute penalty on the residual sum of squares. Neither rescales the
data, so on a series whose noise is much wider than 1 the penalty is
effectively negligible and the segmentation shatters. On 200 observations
with one true changepoint in the middle and a jump of five standard
deviations, "pelt" returns 1 changepoint at \(\sigma = 1\), 27
at \(\sigma = 3\) and 76 at \(\sigma = 10\). These are means over 20
draws, because a single draw is not stable here: the same settings gave
15/38 at \(n = 100\) and 47/152 at \(n = 400\), so the effect grows
with the series as well as with the noise. (0.5.0, before the two-point
minimum segment, reported 39 and 141 at \(n = 200\): the floor halves
the damage and does not remove it.) A measured scale-sensitive engine
given noise far from unit scale warns (class
ggchangepoint_scale_sensitive). Three ways to avoid it, in order
of convenience:
standardise the series first (
cpt_detect(scale(x)[, 1], method = "pelt"));pass a penalty on the data's own scale, for example
penalty = 2 * log(length(x)) * stats::var(diff(x)) / 2;use
change_in = "meanvar", which estimates a variance per segment and is unaffected.
Most other engines are unaffected: SMUCE, WBS, WBS2, NOT, MOSUM,
Isolate-Detect, TGUH, CPOP, "bcp", "beast" and the
nonparametric and multivariate methods estimate or cancel the noise scale
internally, and returned the same segmentation at a thousandth, one and
a thousand times the units. Five did not, on the same series:
"geomcp" runs PELT on its mapped distance and angle series and so
inherits the sensitivity above; "decafs" floors its noise
estimate at about 0.03, so it under-segments a series whose noise is
smaller than that; "bocpd"'s default prior is on the data's
own scale; and "envcpt" and "var" changed their answer
with the units too (var's gamma_set and lambda_set
penalise a squared-error loss on an absolute scale). At a
thousandth of the units "decafs", "bocpd" and
"var" found nothing. Standardising first avoids all five, and
cpt_invariances holds the measurement.
See also
cpt_methods() for what is available and what each
method can do. To get the result out: tidy.ggcpt(),
glance.ggcpt(), augment.ggcpt(),
summary.ggcpt() and print.ggcpt(). To
draw it: autoplot.ggcpt(). For the penalty:
cpt_penalty().
Examples
set.seed(2022)
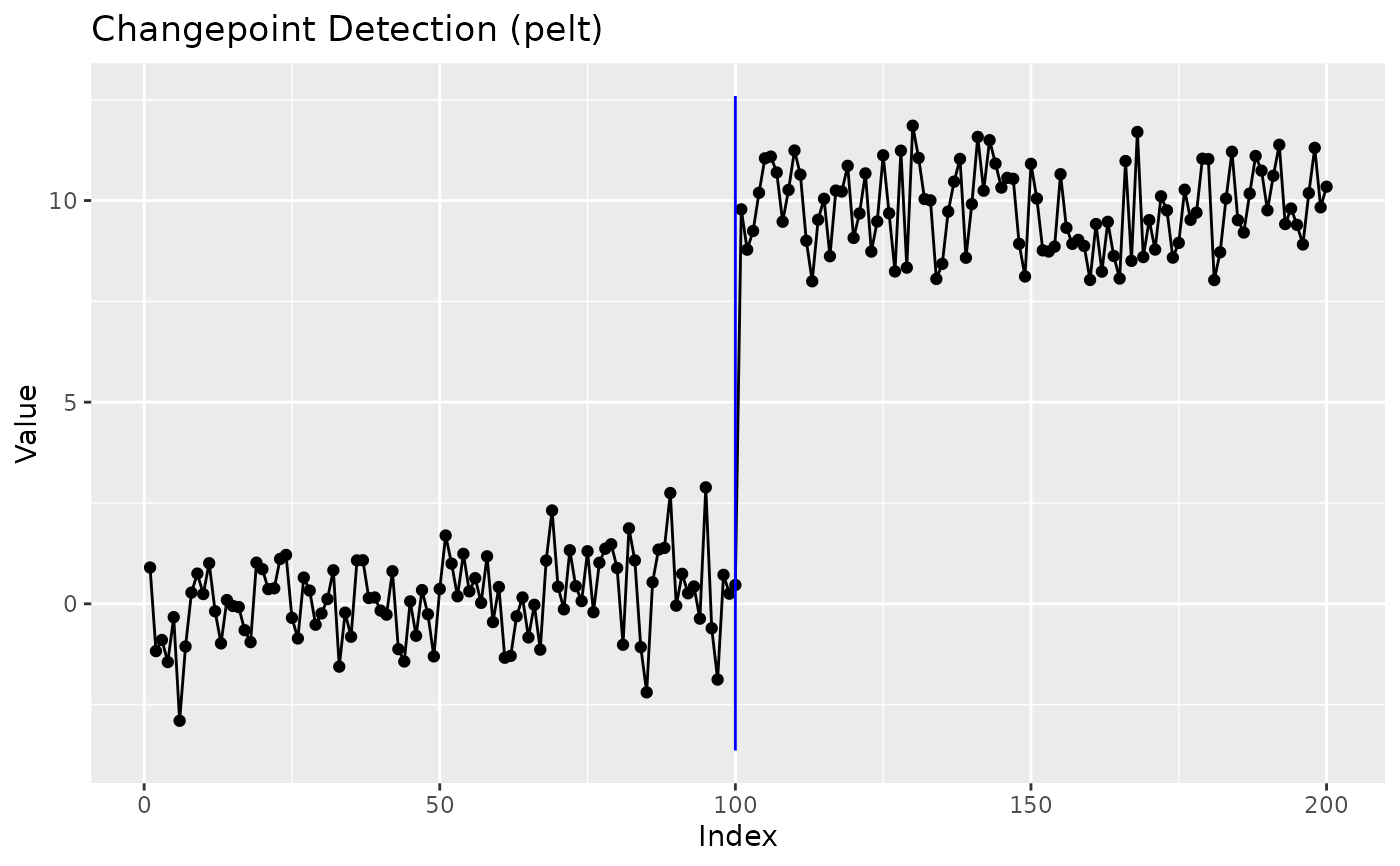
x <- c(rnorm(100, 0, 1), rnorm(100, 10, 1))
result <- cpt_detect(x, method = "pelt", change_in = "mean")
result
#> ggcpt (changepoint detection result)
#> Method: pelt
#> Change in: mean
#> Changepoints found: 1
#> CP convention: left
#> Penalty: MBIC
#> Series length: 200
#>
#> Changepoints:
#> # A tibble: 1 × 2
#> cp cp_value
#> <int> <dbl>
#> 1 100 0.467
ggplot2::autoplot(result)
 # A date index: detection is unchanged, but the report speaks in dates.
dates <- as.Date("2000-01-01") + 0:199
dated <- cpt_detect(x, method = "pelt", index = dates)
tidy(dated)
#> # A tibble: 1 × 3
#> cp cp_index cp_value
#> <int> <date> <dbl>
#> 1 100 2000-04-09 0.467
# The data-frame interface.
df <- data.frame(day = dates, value = x)
cpt_detect(df, y = value, index = day, method = "pelt")
#> ggcpt (changepoint detection result)
#> Method: pelt
#> Change in: mean
#> Changepoints found: 1
#> CP convention: left
#> Penalty: MBIC
#> Series length: 200
#> Index: 2000-01-01 to 2000-07-18
#>
#> Changepoints:
#> # A tibble: 1 × 3
#> cp cp_index cp_value
#> <int> <date> <dbl>
#> 1 100 2000-04-09 0.467
# Counts, with a cost written for them.
counts <- c(rpois(100, 2), rpois(100, 6))
cpt_detect(counts, method = "pelt", family = "poisson")
#> ggcpt (changepoint detection result)
#> Method: pelt
#> Change in: mean
#> Changepoints found: 1
#> CP convention: left
#> Penalty: MBIC
#> Series length: 200
#> Family: poisson
#>
#> Changepoints:
#> # A tibble: 1 × 2
#> cp cp_value
#> <int> <dbl>
#> 1 100 1
# Missing values, located in the original positions.
gappy <- x
gappy[c(20, 21, 150)] <- NA
cpt_detect(gappy, method = "pelt", na_action = "omit")$changepoints
#> # A tibble: 1 × 2
#> cp cp_value
#> <int> <dbl>
#> 1 100 0.467
# A changepoint known in advance, and a window for another.
cpt_detect(x, method = "pelt", fixed = 50)$changepoints
#> # A tibble: 2 × 3
#> cp cp_value fixed
#> <int> <dbl> <lgl>
#> 1 50 0.368 TRUE
#> 2 100 0.467 FALSE
# Breakpoints in a regression.
if (requireNamespace("strucchange", quietly = TRUE)) {
d <- data.frame(t = 1:200, z = rnorm(200))
d$y <- ifelse(d$t <= 120, 1 + d$z, 3 - d$z) + rnorm(200, 0, 0.5)
fit <- cpt_detect(y ~ z, data = d, method = "strucchange")
tidy(fit, "coefficients")
}
#> # A tibble: 4 × 8
#> segment start end term estimate std_error conf_low conf_high
#> <int> <int> <int> <chr> <dbl> <dbl> <dbl> <dbl>
#> 1 1 1 120 (Intercept) 1.01 0.0386 0.929 1.08
#> 2 1 1 120 z 0.960 0.0415 0.878 1.04
#> 3 2 121 200 (Intercept) 2.95 0.0542 2.84 3.05
#> 4 2 121 200 z -1.06 0.0460 -1.15 -0.971
# A date index: detection is unchanged, but the report speaks in dates.
dates <- as.Date("2000-01-01") + 0:199
dated <- cpt_detect(x, method = "pelt", index = dates)
tidy(dated)
#> # A tibble: 1 × 3
#> cp cp_index cp_value
#> <int> <date> <dbl>
#> 1 100 2000-04-09 0.467
# The data-frame interface.
df <- data.frame(day = dates, value = x)
cpt_detect(df, y = value, index = day, method = "pelt")
#> ggcpt (changepoint detection result)
#> Method: pelt
#> Change in: mean
#> Changepoints found: 1
#> CP convention: left
#> Penalty: MBIC
#> Series length: 200
#> Index: 2000-01-01 to 2000-07-18
#>
#> Changepoints:
#> # A tibble: 1 × 3
#> cp cp_index cp_value
#> <int> <date> <dbl>
#> 1 100 2000-04-09 0.467
# Counts, with a cost written for them.
counts <- c(rpois(100, 2), rpois(100, 6))
cpt_detect(counts, method = "pelt", family = "poisson")
#> ggcpt (changepoint detection result)
#> Method: pelt
#> Change in: mean
#> Changepoints found: 1
#> CP convention: left
#> Penalty: MBIC
#> Series length: 200
#> Family: poisson
#>
#> Changepoints:
#> # A tibble: 1 × 2
#> cp cp_value
#> <int> <dbl>
#> 1 100 1
# Missing values, located in the original positions.
gappy <- x
gappy[c(20, 21, 150)] <- NA
cpt_detect(gappy, method = "pelt", na_action = "omit")$changepoints
#> # A tibble: 1 × 2
#> cp cp_value
#> <int> <dbl>
#> 1 100 0.467
# A changepoint known in advance, and a window for another.
cpt_detect(x, method = "pelt", fixed = 50)$changepoints
#> # A tibble: 2 × 3
#> cp cp_value fixed
#> <int> <dbl> <lgl>
#> 1 50 0.368 TRUE
#> 2 100 0.467 FALSE
# Breakpoints in a regression.
if (requireNamespace("strucchange", quietly = TRUE)) {
d <- data.frame(t = 1:200, z = rnorm(200))
d$y <- ifelse(d$t <= 120, 1 + d$z, 3 - d$z) + rnorm(200, 0, 0.5)
fit <- cpt_detect(y ~ z, data = d, method = "strucchange")
tidy(fit, "coefficients")
}
#> # A tibble: 4 × 8
#> segment start end term estimate std_error conf_low conf_high
#> <int> <int> <int> <chr> <dbl> <dbl> <dbl> <dbl>
#> 1 1 1 120 (Intercept) 1.01 0.0386 0.929 1.08
#> 2 1 1 120 z 0.960 0.0415 0.878 1.04
#> 3 2 121 200 (Intercept) 2.95 0.0542 2.84 3.05
#> 4 2 121 200 z -1.06 0.0460 -1.15 -0.971