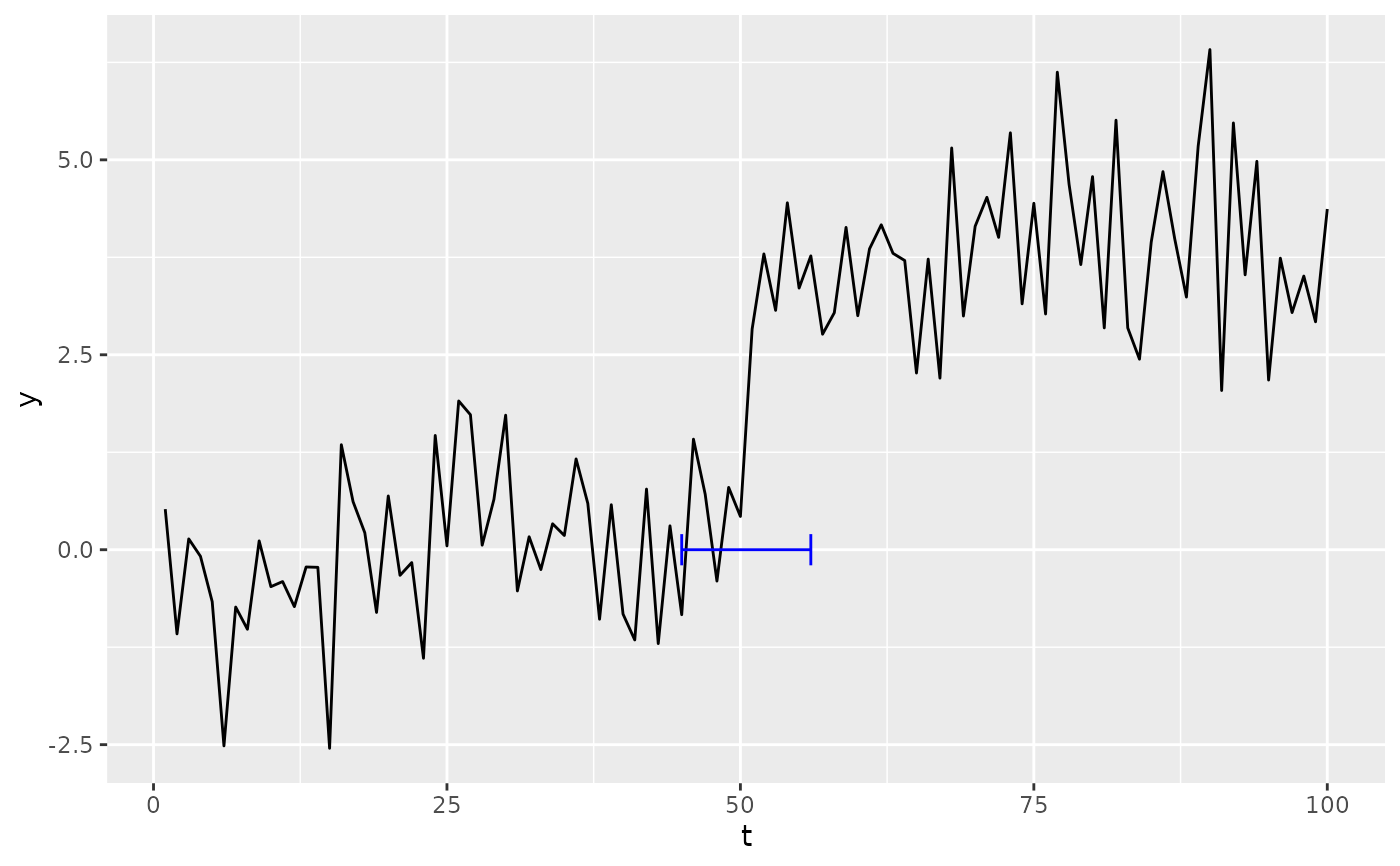
Draws horizontal whiskers for changepoint-location confidence intervals (e.g. from MOSUM, stepR, strucchange, segmented).
Arguments
- mapping
Aesthetic mappings. Requires
y(the height at which to draw the whisker) together withxminandxmax. Anxaesthetic is accepted but not needed: the layer is a horizontal error bar, so the interval is given byxmin/xmaxand the changepoint itself is usually marked with a separate point layer, asautoplot(show_ci = TRUE)does.- data
A data frame with CI information.
- ...
Other arguments passed to
geom_errorbar(withorientation = "y";geom_errorbarh()is deprecated).- na.rm
If
FALSE, missing values are removed.- show.legend
Whether to show legend.
See also
Other ggplot2 layers:
geom_changepoint(),
geom_cpt_event(),
geom_cpt_label(),
geom_cpt_region(),
geom_cpt_segment(),
ggchangepoint-ggproto,
stat_changepoint(),
stat_cpt_region()