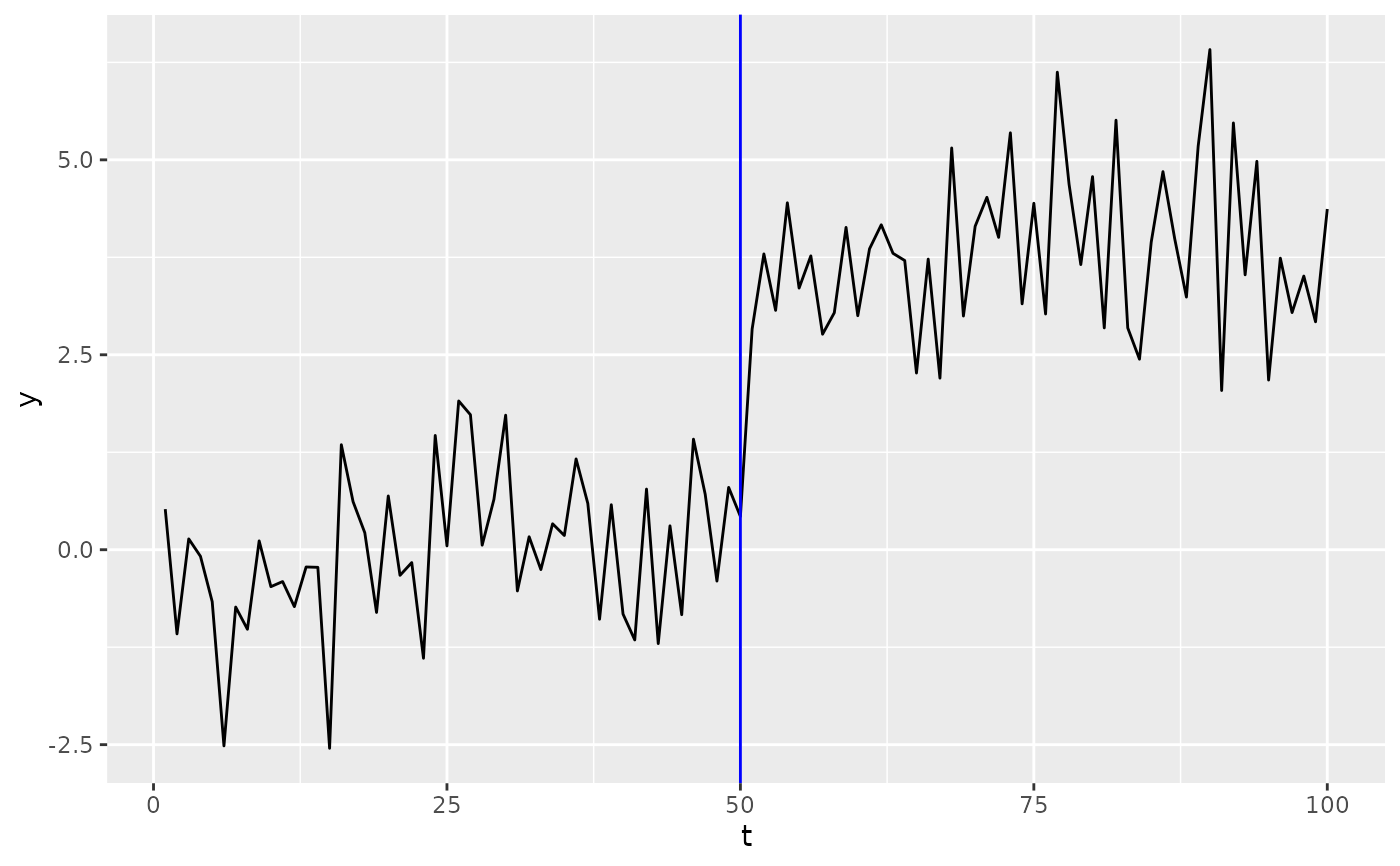
Runs changepoint detection inside the ggplot pipeline. Useful for
quick exploration: ggplot(df, aes(t, y)) + geom_line() +
stat_changepoint(method = "pelt"). Draws vertical lines at detected
changepoint locations.
Usage
stat_changepoint(
  mapping = NULL,
  data = NULL,
  geom = "vline",
  position = "identity",
  ...,
  method = "pelt",
  change_in = "mean",
  na.rm = FALSE,
  show.legend = NA
)
Arguments
- mapping
Aesthetic mappings.
- data
A data frame.
- geom
The geometric object to use (default:
"vline"). The stat computes a singlexinterceptper changepoint and dropsx/y, so"vline"is the geom that fits. A geom needingx/y("point", and"rug", which consumesx/yrather thanxintercept) errors for that reason.inherit.aesis fixed atTRUEhere: the stat re-detects on the plot's own data, so the panel'sx/ymapping is what it reads.- position
Position adjustment.
- ...
Other arguments passed to the geom.
- method
Detection method (passed to
cpt_detect).- change_in
What to detect change in (passed to
cpt_detect).- na.rm
If
FALSE, missing values are removed.- show.legend
Whether to show legend.
See also
Other ggplot2 layers:
geom_changepoint(),
geom_cpt_ci(),
geom_cpt_event(),
geom_cpt_label(),
geom_cpt_region(),
geom_cpt_segment(),
ggchangepoint-ggproto,
stat_cpt_region()