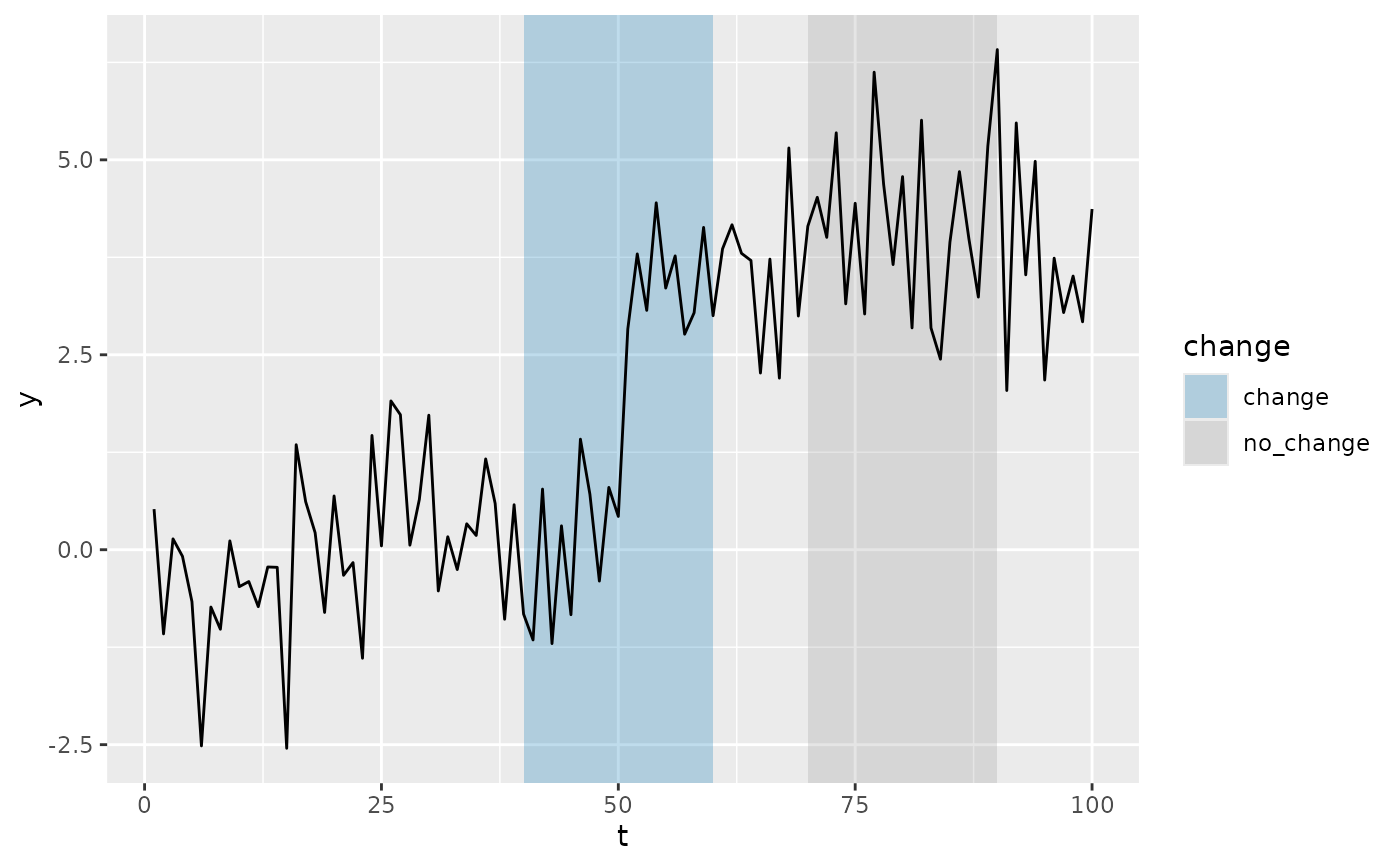
Draws labelled regions behind a series: the central object of supervised
changepoint detection (Hocking et al.), where an expert marks intervals as
containing a change or not and the penalty is learned from those labels.
Fill defaults to the label's change status, so a plot of labels
reads as a picture of what the expert asserted; map fill to the
status column of cpt_label_error() instead to get the
correct / false-positive / false-negative display.
Usage
geom_cpt_label(
  mapping = NULL,
  data = NULL,
  ...,
  alpha = 0.25,
  colour = NA,
  na.rm = FALSE,
  show.legend = NA,
  inherit.aes = FALSE
)
Arguments
- mapping
Aesthetic mappings. Requires
xminandxmax;ymin/ymaxdefault to the panel extent.fillis commonly mapped tochangeorstatus.- data
A data frame of labels, e.g.
cpt_labels()output.- ...
Other arguments passed to
ggplot2::geom_rect().- alpha
Fill transparency. Defaults to
0.25.- colour
Border colour. Defaults to
NA(no border).- na.rm
If
FALSE, missing values are removed with a warning.- show.legend
Whether to show a legend.
- inherit.aes
Whether to inherit the plot's aesthetics. Defaults to
FALSE.