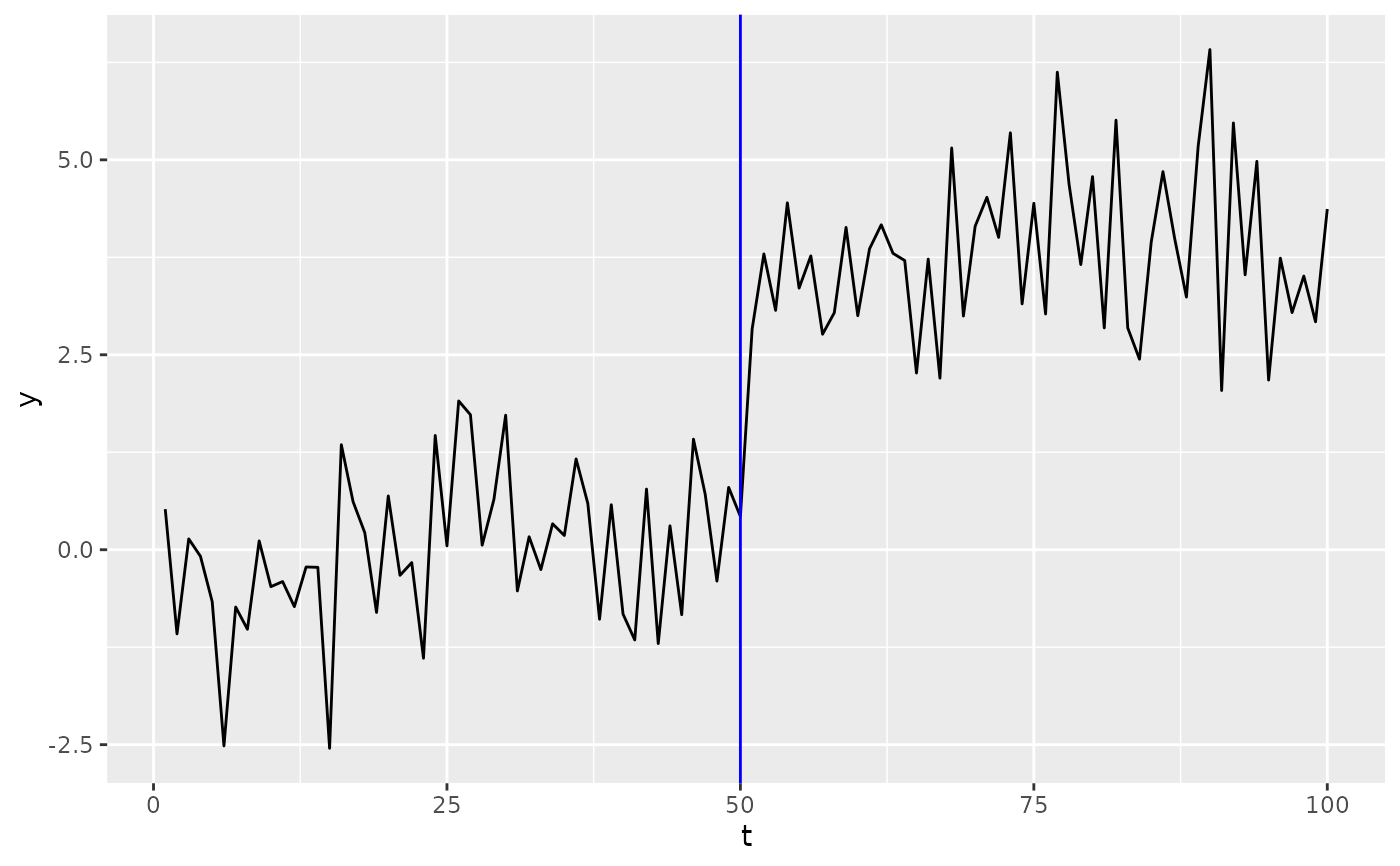
Draws vertical lines at changepoint locations. Mimics geom_vline
but designed to work with the tidy changepoint data frames returned by
the package. Can be used as a standalone layer:
geom_changepoint(data = cp_df, aes(xintercept = cp)).
Arguments
- mapping
Set of aesthetic mappings created by
ggplot2::aes(). Requiresxintercept.- data
A data frame with changepoint information.
- ...
Other arguments passed to
geom_vline.- na.rm
If
FALSE, missing values are removed.- show.legend
Whether to show legend.
See also
Other ggplot2 layers:
geom_cpt_ci(),
geom_cpt_event(),
geom_cpt_label(),
geom_cpt_region(),
geom_cpt_segment(),
ggchangepoint-ggproto,
stat_changepoint(),
stat_cpt_region()
Examples
library(ggplot2)
set.seed(2026)
d <- data.frame(t = 1:100, y = c(rnorm(50), rnorm(50, 4)))
cp <- data.frame(cp = cpt_detect(d$y, method = "pelt")$changepoints$cp)
ggplot(d, aes(t, y)) + geom_line() +
  geom_changepoint(aes(xintercept = cp), data = cp, colour = "blue")