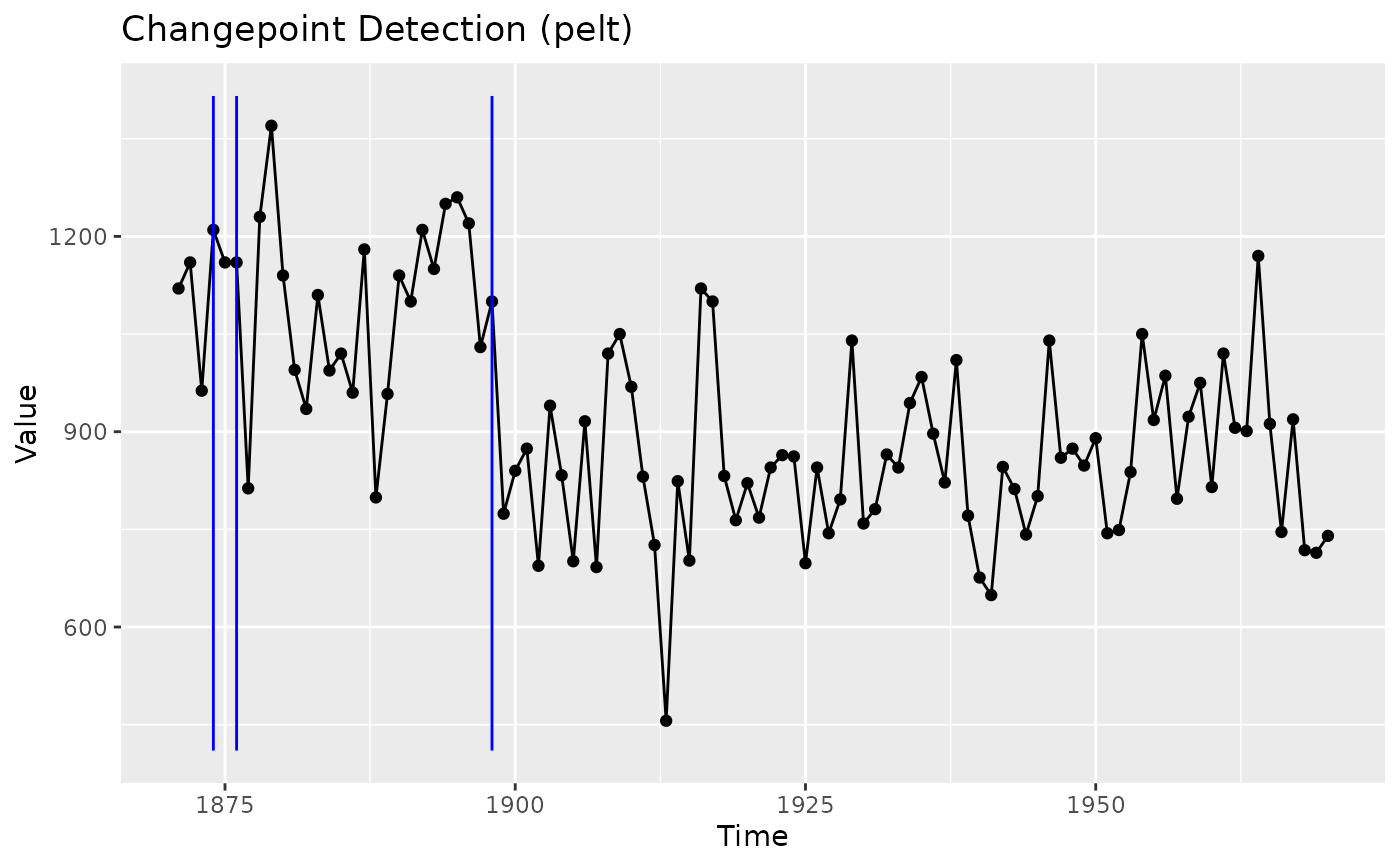
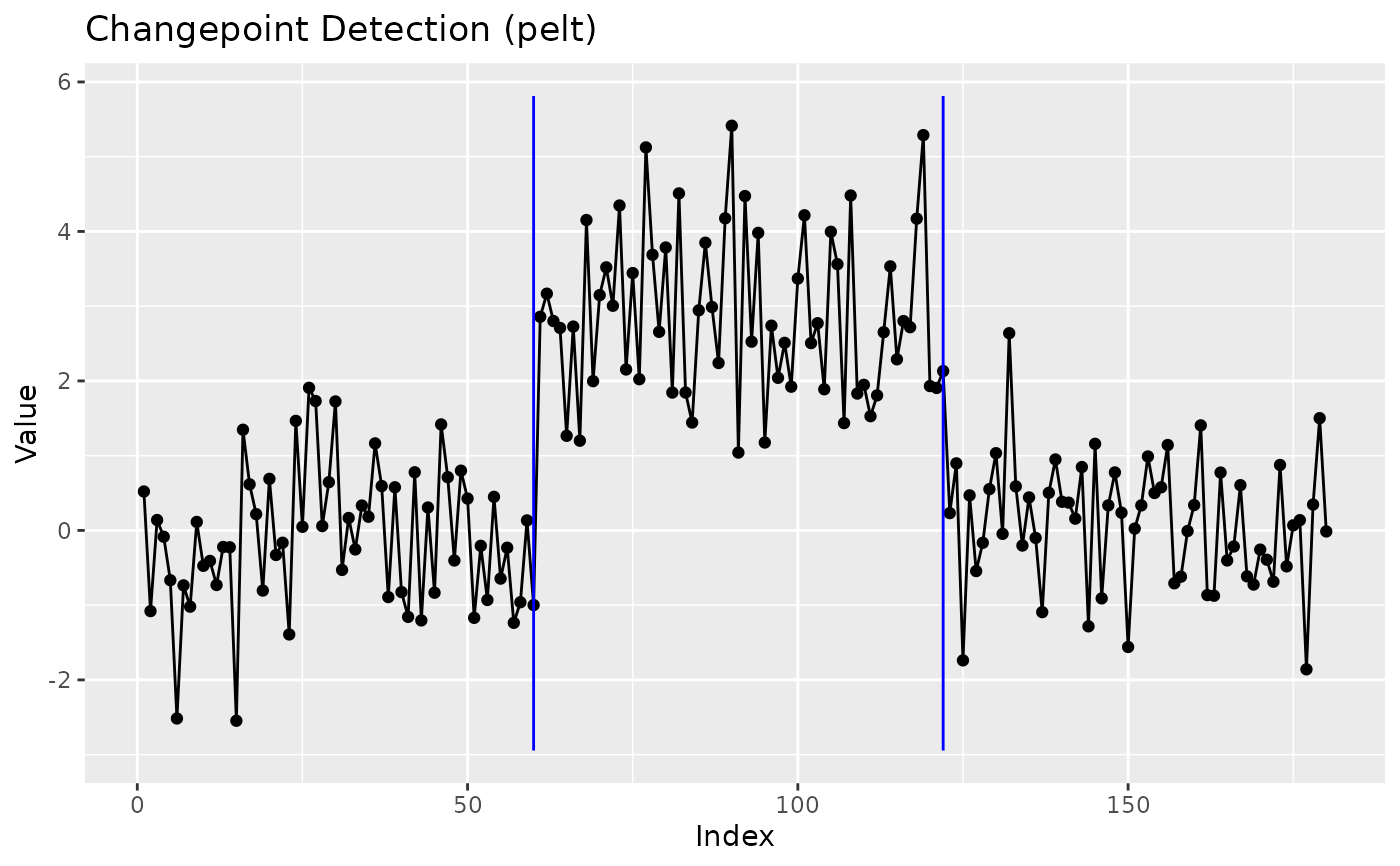
Renders a changepoint detection result as a ggplot. The raw series is drawn
as a line (with optional points), changepoints are shown as vertical lines,
and (optionally) fitted segment levels, the engine's fitted signal, and
changepoint-location confidence intervals are overlaid. Multivariate
results (from ecp, inspect, geomcp, ...) are drawn as
faceted small-multiples with shared changepoint rules.
Usage
# S3 method for class 'ggcpt'
autoplot(
  object,
  show_segments = FALSE,
  show_ci = FALSE,
  show_fit = FALSE,
  show_regions = NULL,
  cptline_alpha = 1,
  cptline_color = "blue",
  cptline_type = "solid",
  cptline_linewidth = 0.5,
  show_points = NULL,
  show_line = TRUE,
  index = NULL,
  labels = NULL,
  type = c("series", "statistic", "path", "scale_space", "diagnostics"),
  ...
)
Arguments
- object
A
ggcptobject.- show_segments
Logical. Whether to draw the fitted segment means. Defaults to
FALSE.- show_ci
Logical. Whether to draw confidence intervals for changepoint locations, when the engine provides them (columns
ci_lower/ci_upperon the changepoints tibble, supplied by the enginescpt_methods()marks in itscicolumn:smuce,hsmuce,strucchange,segmented,mcp,bfastandtaylor).nspis marked there as well but is not drawn by this argument: it reportsregion_start/region_endrather than an interval around an estimate, whichshow_regionsdraws. Drawn as horizontal whiskers near the bottom of the panel. Defaults toFALSE.- show_fit
Logical. Whether to draw the engine's fitted signal (the
fittedcolumn of$data, provided by the enginescpt_methods()marks in itsfittedcolumn:smuce,hsmuce,cpop,bcp,bocpd(a causal running mean),beast,decafs,segmented,envcpt,mcpandbfast, plus every formula fit). Defaults toFALSE.- show_regions
Logical. Whether to shade the significance regions an interval-valued method returns (the
regionsslot; currentlynsp_wrapper()). Each band is an interval that contains at least one changepoint at the stated global level; it is not a confidence interval around a point estimate. Defaults toTRUEwhen the result carries regions, and is ignored otherwise.- cptline_alpha
Alpha for changepoint lines. Defaults to
1.- cptline_color
Color for changepoint lines. Defaults to
"blue".- cptline_type
Linetype for changepoint lines. Defaults to
"solid".- cptline_linewidth
Linewidth for changepoint lines. Defaults to
0.5.- show_points
Logical. Whether to draw data points. Auto-off above 500 obs.
- show_line
Logical. Whether to draw the line. Defaults to
TRUE.- index
Optional vector of x-axis values (e.g. dates) of the same length as the series. Defaults to the time index carried by the result (see the
indexargument ofcpt_detect()), and to the observation position when there is none.- labels
Optional
cpt_labels()tibble. When supplied, the labelled regions are shaded behind the series and coloured by the outcomecpt_label_error()gives them (correct, false positive, false negative), so scoring a segmentation against expert labels becomes a picture rather than a table. Not drawn for a multivariate result, which warns instead.- type
Which view to draw.
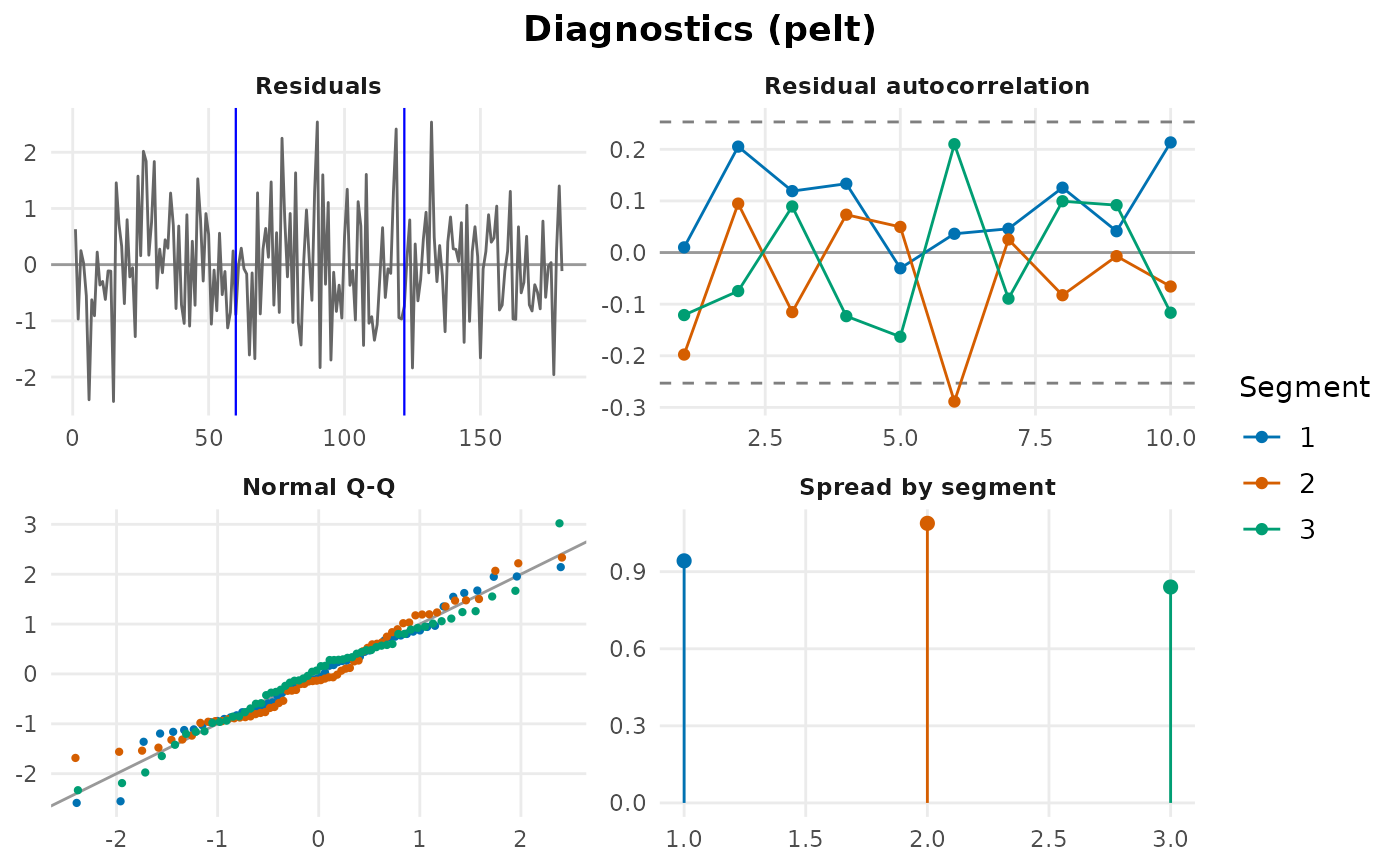
"series"(default) is the series with its changepoints;"statistic"and"path"delegate toggcpt_statistic()andggcpt_solution_path(), which error with the list of supporting engines when this one does not expose the internals."scale_space"delegates toggcpt_scale_space(), which needs nothing from the engine: it sweeps a multiscale detector over the same series, so it draws for any result."diagnostics"is the residual check of the fit in four panels: the residuals with the segment boundaries (structure left behind), their autocorrelation per segment (the independence most engines assume), a normal Q-Q plot per segment (the Gaussian cost) and the spread of each segment (a constant variance);cpt_gof()gives the same checks as numbers.- ...
Unknown arguments are ignored with a warning, except when
typeis not"series", in which case they are passed to the delegate.
See also
ggcpt_plot_methods for the base plot()
methods that delegate here, and theme_ggcpt() and
geom_changepoint() for restyling and re-assembling the
layers by hand.
Examples
set.seed(2026)
fit <- cpt_detect(c(rnorm(60), rnorm(60, 3), rnorm(60)), method = "pelt")
ggplot2::autoplot(fit)
 ggplot2::autoplot(fit, type = "diagnostics")
 # a dated series draws its dates
dated <- cpt_detect(Nile, method = "pelt", change_in = "meanvar")
ggplot2::autoplot(dated)
# a dated series draws its dates
dated <- cpt_detect(Nile, method = "pelt", change_in = "meanvar")
ggplot2::autoplot(dated)