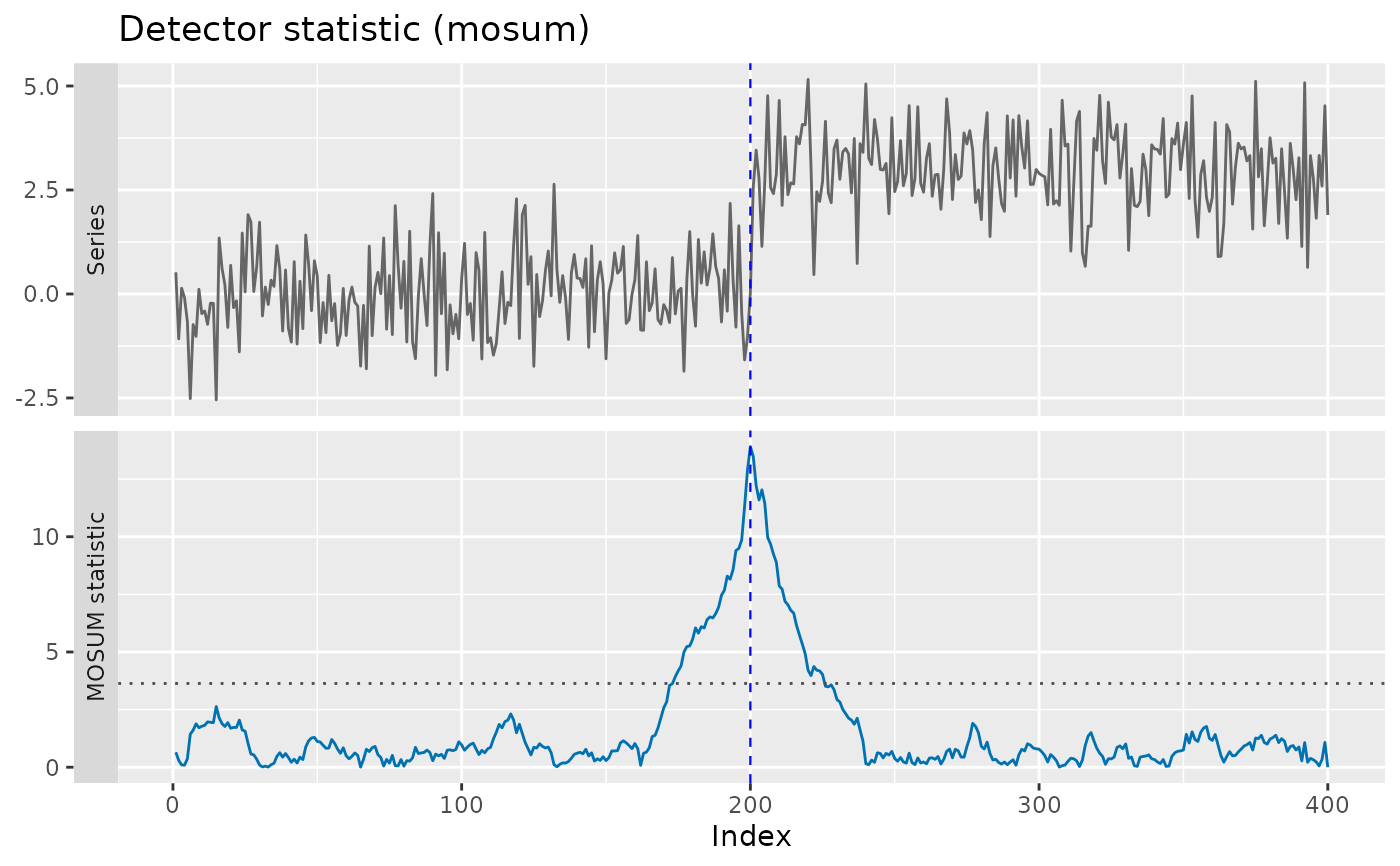
Returns the criterion the engine evaluated at each position, which is what
explains why a changepoint landed where it did. Available for the
engines that expose it
(subset(cpt_methods(), statistic)$method lists them), and an error
naming those engines for the ones that do not.
Value
cpt_statistic() returns a tibble with index,
statistic, threshold (the engine's rejection threshold, or
NA) and label (what the statistic is).
ggcpt_statistic() returns a two-panel ggplot: the series above,
the statistic below, sharing the x axis.
Examples
set.seed(2026)
fit <- cpt_detect(c(rnorm(200), rnorm(200, 3)), method = "mosum")
head(cpt_statistic(fit))
#> # A tibble: 6 × 4
#>   index statistic threshold label
#>   <int>     <dbl>     <dbl> <chr>
#> 1     1    0.648       3.63 MOSUM statistic
#> 2     2    0.295       3.63 MOSUM statistic
#> 3     3    0.102       3.63 MOSUM statistic
#> 4     4    0.0887      3.63 MOSUM statistic
#> 5     5    0.365       3.63 MOSUM statistic
#> 6     6    1.43        3.63 MOSUM statistic
ggcpt_statistic(fit)