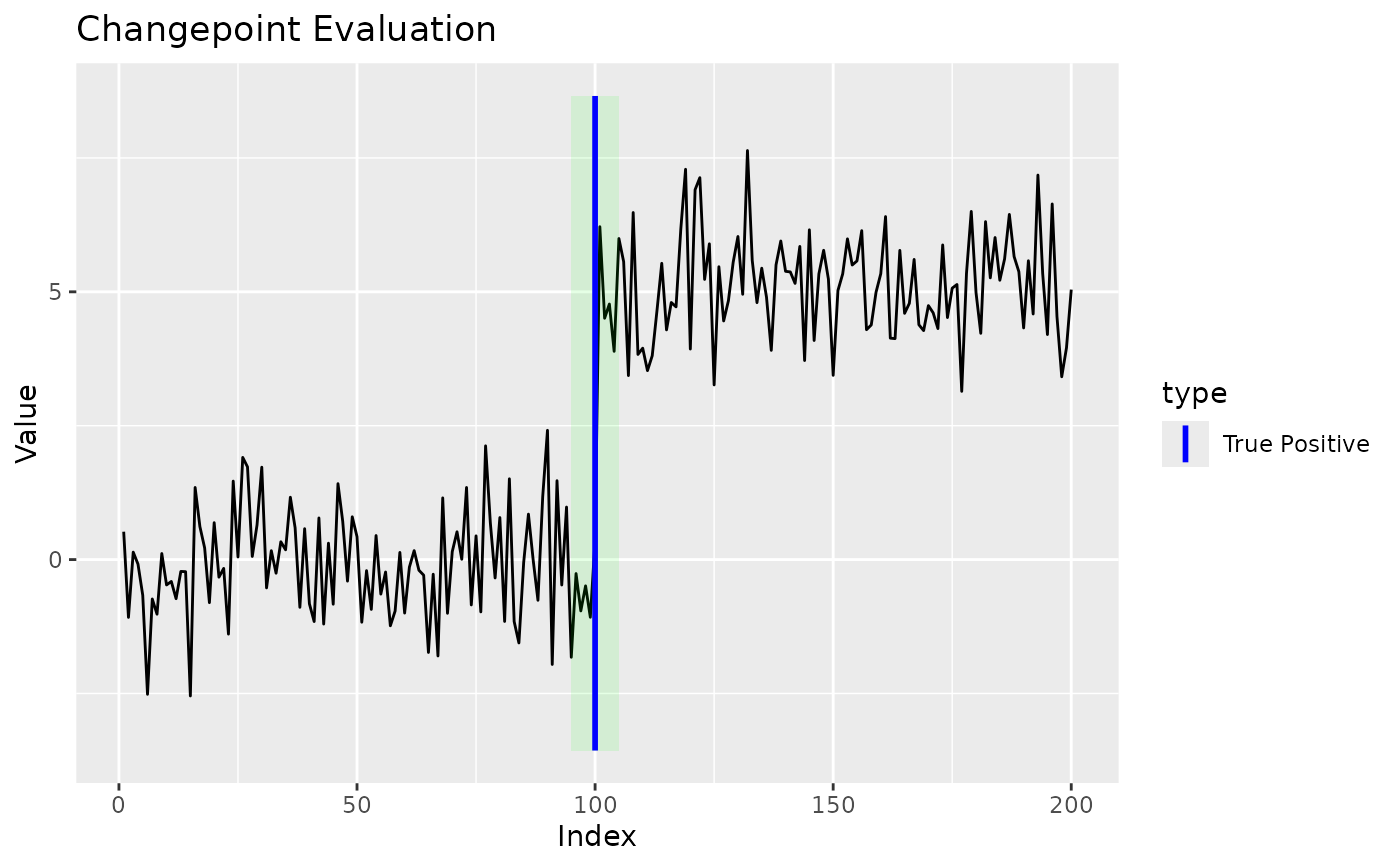
Overlays predictions and ground truth on the series with tolerance windows,
colouring true positives, false positives, and misses. Uses the same
one-to-one matching as cpt_metrics(), so the plot and the
metrics agree.
See also
Other plotting:
ggcpt_compare_table(),
ggcpt_interactive(),
ggcptplot(),
ggecpplot()
Examples
set.seed(2026)
x <- c(rnorm(100), rnorm(100, 5))
fit <- cpt_detect(x, method = "pelt")
ggcpt_eval(fit$changepoints$cp, truth = 100, data_vec = x)