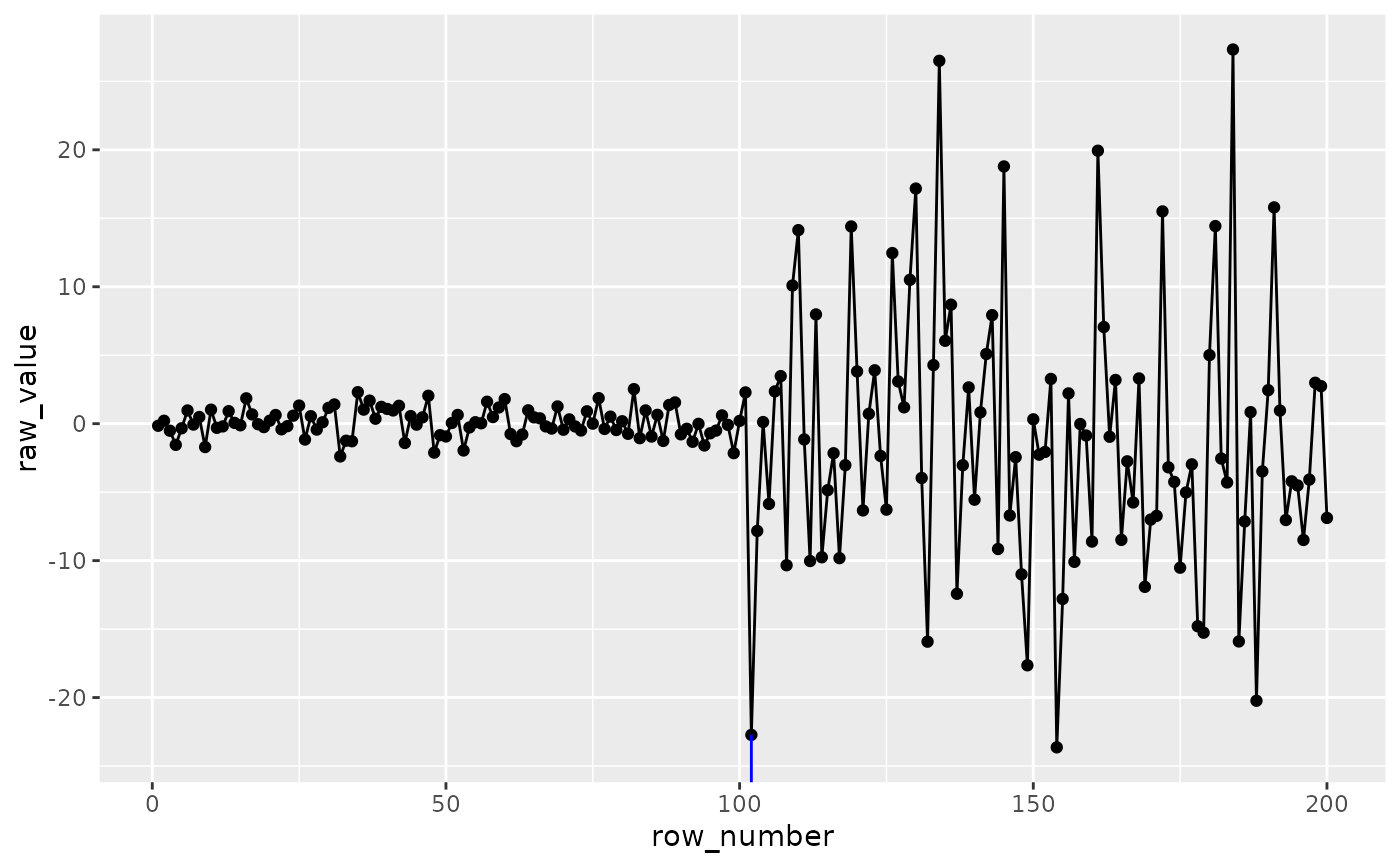
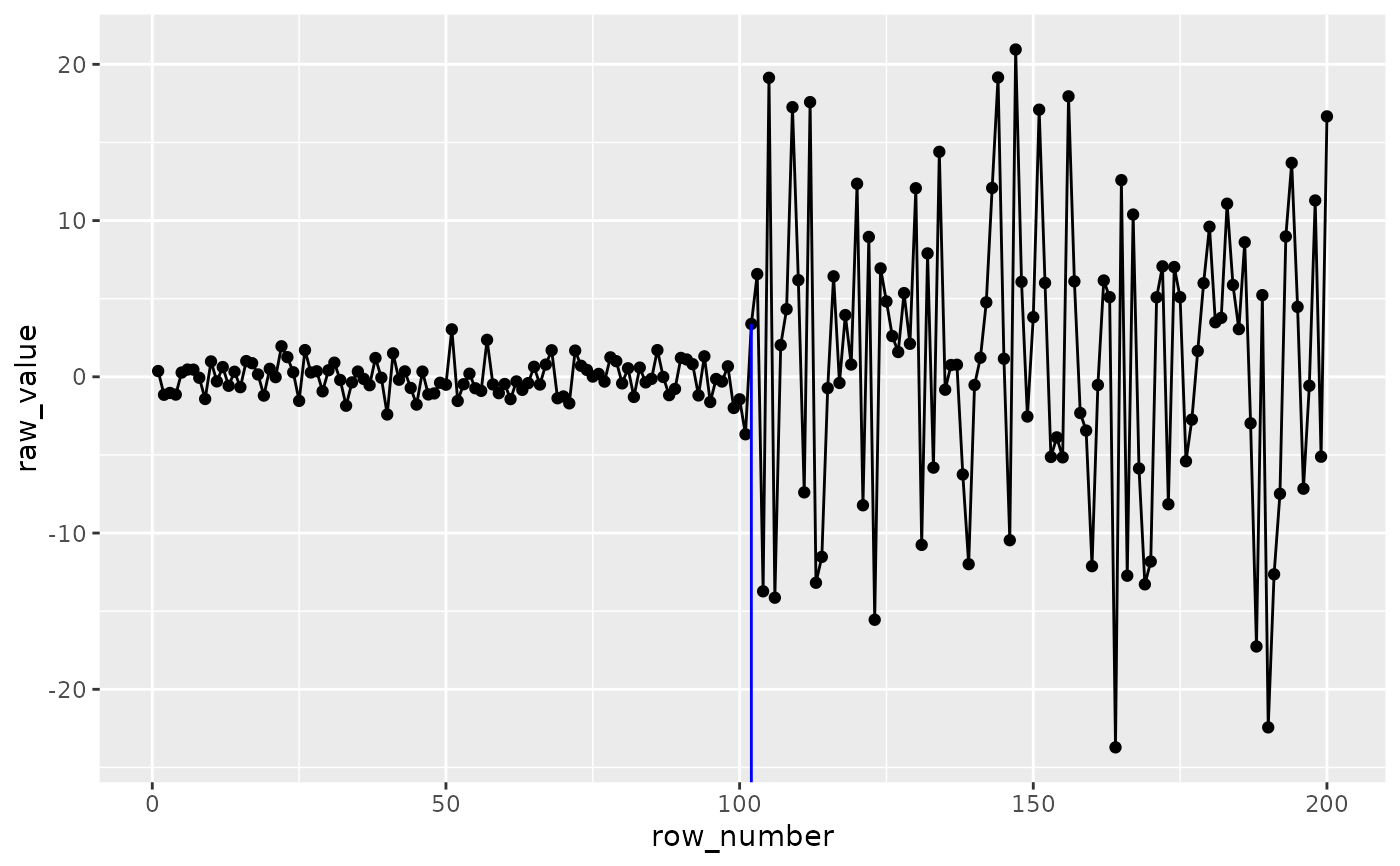
The plot for changepoints detected by the ecp package is a line plot for the raw data and the vertical lines representing each changepoint. The x-axis is the row number of the raw data in the original data vector. The plot inherits ggplot2, meaning users can add ggplot2 functions on top the changepoint plot for customization.
Usage
ggecpplot(
  data,
  algorithm = "divisive",
  min_size = 2,
  ...,
  cptline_alpha = 1,
  cptline_color = "blue",
  cptline_type = "solid",
  cptline_linewidth = 0.5,
  cptline_size = lifecycle::deprecated(),
  index = NULL,
  show_points = NULL,
  show_line = TRUE
)
Arguments
- data
A numeric vector (for univariate) or matrix/data.frame (for multivariate).
- algorithm
Either
divisiveoragglo.divisiveis the default.- min_size
Minimum number of observations between change points. By default is 2. This argument is only applied when
algorithm = "divisive".- ...
Extra arguments to pass on either from
e.divisive()ore.agglo().- cptline_alpha
The value of alpha for the vertical changepoint line(s), default is 1, meaning no transparency.
- cptline_color
The color for the vertical changepoint line(s), default is
blue.- cptline_type
The linetype for the vertical changepoint line(s), default is
solid.- cptline_linewidth
The linewidth for the vertical changepoint line(s), default is
0.5.- cptline_size
Deprecated. Use
cptline_linewidthinstead.- index
Optional. A vector of x-axis labels (e.g. dates) of the same length as
data.- show_points
Logical. Whether to draw data points. Defaults to
TRUEwhenlength(data) <= 500,FALSEotherwise.- show_line
Logical. Whether to draw the line. Defaults to
TRUE.
See also
Other plotting:
ggcpt_compare_table(),
ggcpt_eval(),
ggcpt_interactive(),
ggcptplot()