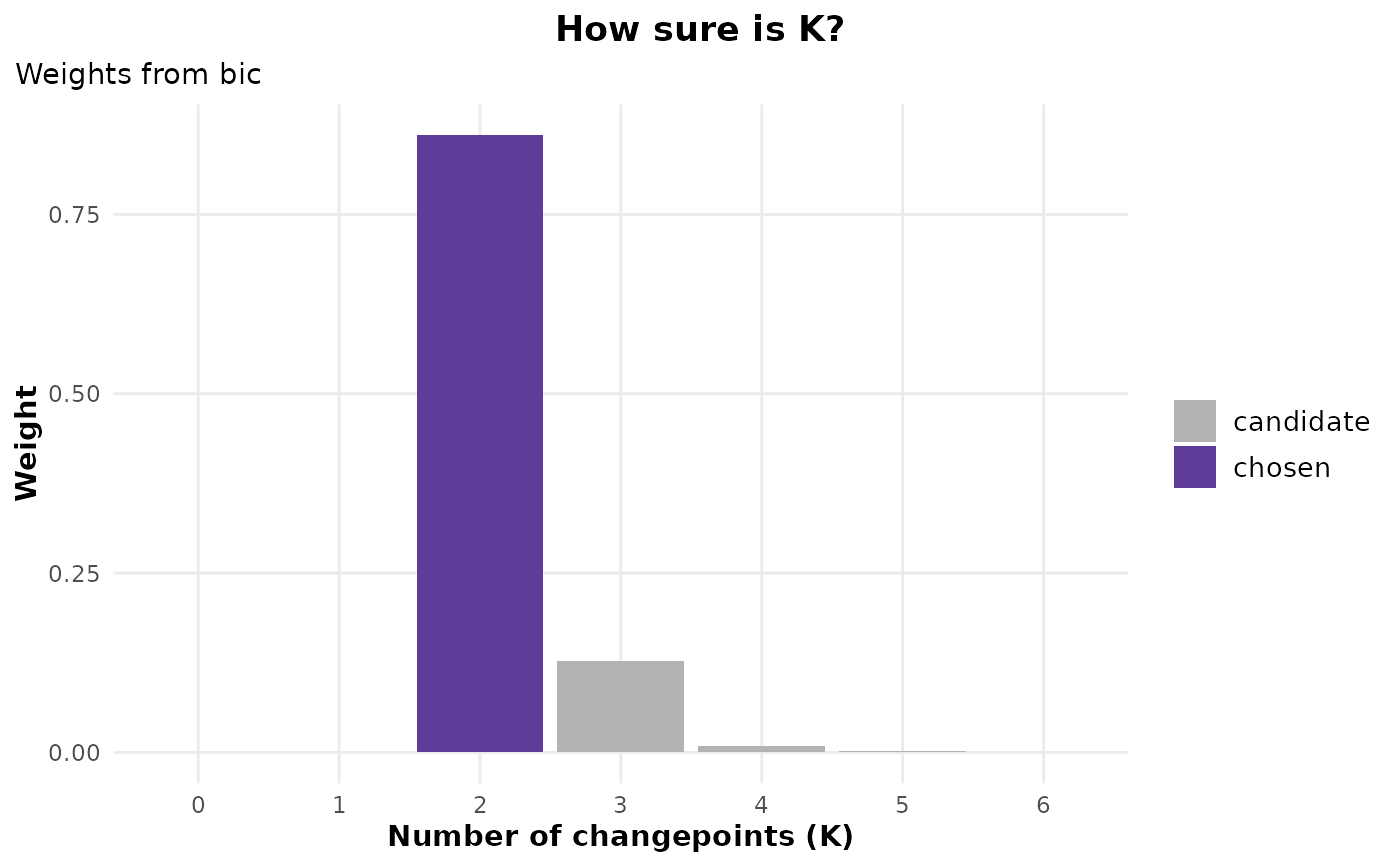
Turns the criterion curve of cpt_select() into weights over
the candidate numbers of changepoints, and averages the candidate
segmentations under those weights into a probability, at each location,
that it is a changepoint.
Arguments
- sel
A
ggcpt_selectionfromcpt_select()withcriterion = "bic","mbic"or"aic": the criteria on the deviance scale, where weights have their meaning.- x
A
ggcpt_k_weightsobject.- ...
Ignored.
- what
"k"(default) for the weights,"locations"for the model-averaged location probabilities.- object
A
ggcpt_k_weightsobject.
Value
A ggcpt_k_weights tibble with one row per candidate:
k, value (the criterion), delta, weight
and chosen. tidy(x, what = "locations") returns the
model-averaged probability of a changepoint at each location any
candidate uses (position, index, probability);
autoplot(x) draws the weights and autoplot(x, what =
"locations") the probabilities. print() and glance()
(the chosen K, its weight, and the smallest set of K holding 95% of
the weight) work on it.
The weights
With \(\Delta_K\) the criterion of \(K\) changepoints minus the
smallest, the weight of \(K\) is \(\exp(-\Delta_K / 2)\) normalised
over the candidates. For "aic" these are Akaike weights; for
"bic" and "mbic" they approximate posterior probabilities
of each \(K\) under equal prior weight. They are conditional on the
candidate segmentations: each \(K\) is represented by the one
segmentation the ladder found for it, so the location probabilities
reflect uncertainty about how many changes there are, not about where a
given one falls (cpt_confint() answers that).
Examples
set.seed(2026)
x <- c(rnorm(80), rnorm(80, 1.2), rnorm(80, 0.4))
sel <- cpt_select(x, criterion = "bic", k_max = 6)
w <- cpt_k_weights(sel)
w
#> ggcpt_k_weights (weights over the number of changepoints, from bic)
#>   Chosen:             K = 2, weight 0.861
#>   Largest weights:    K = 2: 0.861; K = 3: 0.128; K = 4: 0.009
#>   95% of the weight:  K in {2, 3}
#>
#> # A tibble: 7 × 5
#>       k value delta   weight chosen
#>   <int> <dbl> <dbl>    <dbl> <lgl>
#> 1     0  65.4 48.9  2.10e-11 FALSE
#> 2     1  31.3 14.7  5.44e- 4 FALSE
#> 3     2  16.6  0    8.61e- 1 TRUE
#> 4     3  20.4  3.81 1.28e- 1 FALSE
#> 5     4  25.6  9.06 9.29e- 3 FALSE
#> 6     5  29.4 12.9  1.38e- 3 FALSE
#> 7     6  34.5 17.9  1.12e- 4 FALSE
tidy(w, what = "locations")
#> # A tibble: 6 × 3
#>   position index probability
#>      <int> <int>       <dbl>
#> 1       15    15    0.0108
#> 2       37    37    0.00149
#> 3       76    76    1.000
#> 4      117   117    0.139
#> 5      122   122    0.000112
#> 6      161   161    0.999
ggplot2::autoplot(w)