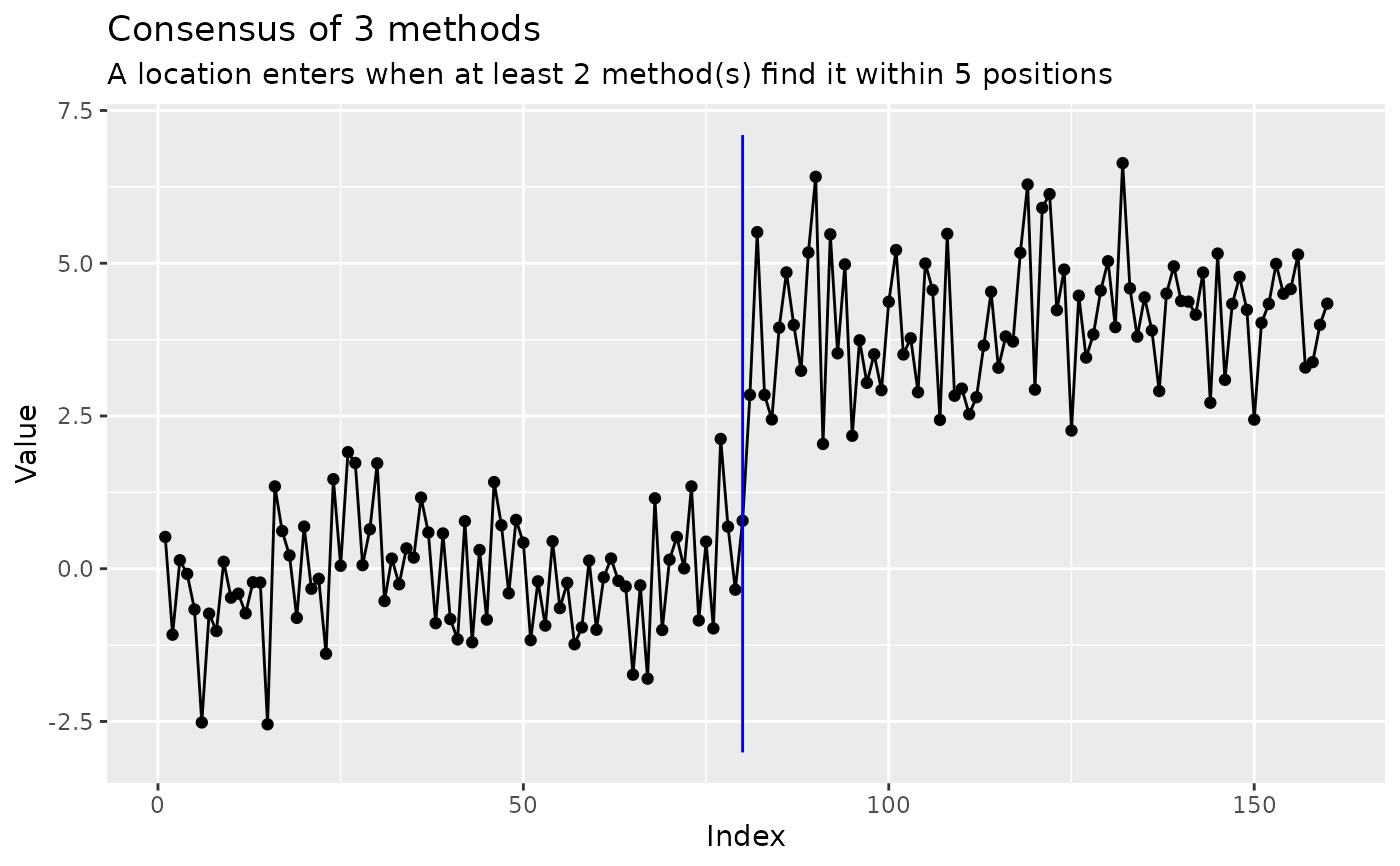
Runs a set of detectors on one series and reports the locations they agree
on. Two detections count as the same changepoint when they fall within
tolerance of each other, the same tolerance window
cpt_metrics() matches on (van den Burg and Williams, 2020),
so the package has one notion of "close enough" and not two. The
grouping necessarily differs: cpt_metrics() matches two
sets one-to-one, while consensus has to cluster \(K\) of them, so
detections are swept in order and a new cluster opens as soon as one lies
more than tolerance from the cluster's first member. That cap stops
a chain of near-neighbours merging into one arbitrarily wide cluster.
Usage
cpt_consensus(
  x,
  methods = c("pelt", "binseg", "amoc"),
  tolerance = 5,
  min_votes = "majority",
  change_in = "mean",
  index = NULL,
  seed = NULL,
  ...
)

# S3 method for class 'ggcpt_consensus'
autoplot(object, plot_type = c("series", "agreement"), ...)

# S3 method for class 'ggcpt_consensus'
print(x, ...)
Arguments
- x
A
ggcpt_consensusobject (forprint()).- methods
Character vector of method names. A method that fails on this series (its engine errors or is not installed, or it does not offer
change_in) is left out of the vote with a warning; invalid data or arguments stop the call.- tolerance
Matching window, in positions. Defaults to
5.- min_votes
Minimum number of methods that must find a location for it to enter the consensus. Defaults to
"majority": more than half of the methods that ran (two of three, three of four or five), so the rule does not silently change with the size of the panel, as a fixed count of two did (a bare majority of three, a fifth of ten)."all"asks for unanimity.A value strictly between 0 and 1 is read as a proportion of the methods that ran; anything else is a count, rounded up (
2.5needs three methods, never two). The boundary is worth knowing, because it falls exactly where a reader thinking in proportions would write “unanimous”: with three methods,min_votes = 0.99needs all three, whilemin_votes = 1(and1.0, which is the same number) is a count of one and so the least strict setting there is. For unanimity, pass the number of methods, or a fraction just below 1.A count larger than the number of methods that ran cannot be reached, so the consensus would be empty by construction; that warns rather than returning a result indistinguishable from “the methods agreed on nothing”.
- change_in
Passed to each detector.
- index
Optional time index, carried onto the result.
- seed
Optional seed for reproducibility. The seed is scoped to this call:
.Random.seedis saved and restored, so a seeded call inside a simulation loop does not pin the loop's own stream.- ...
Passed on to
autoplot.ggcpt()forplot_type = "series".- object
A
ggcpt_consensusobject (forautoplot()).- plot_type
"series"(the consensus segmentation, votes shown by line width) or"agreement"(a method-by-location dot matrix showing exactly who voted for what).
Value
A ggcpt object (so it plots and tidies like any other
result) whose changepoints tibble carries votes and
methods (a comma-separated list of the methods that found each
location), with the per-method detections kept in a
consensus attribute and drawn by autoplot(plot_type =
"agreement").
Consensus does not remove shared false positives
Voting removes the idiosyncrasies of individual algorithms. It does not
remove a false positive that every algorithm makes for the same reason,
and a violated assumption is exactly such a reason: measured under
AR(1) noise, every one of pelt's spurious changepoints was
reproduced by wbs within five observations, and the 2-of-3
consensus of pelt, binseg and wbs had more false
positives (1.40) than two of its own members. The useful signal in a
panel is its disagreement: the disagreement value in
the consensus attribute is the share of the locations any member
found that not every member found, and a high value says the members'
shared assumption may be what is wrong (see
cpt_assumptions() and cpt_robustness()).
Consensus is not inference
Agreement among detectors is not a p-value, and a location found
by six of seven methods is not thereby significant at any level: the
methods are run on the same data and are strongly correlated, several of
them share an engine, and none of the votes is independent. Read the vote
count as a robustness display ("this feature does not depend on which
detector I picked"), and use nsp_wrapper() or
cpt_confint() when you need a guarantee.
References
van den Burg GJJ, Williams CKI (2020). “An evaluation of change point detection algorithms.” arXiv preprint arXiv:2003.06222. doi:10.48550/arXiv.2003.06222 .