Skip to contents

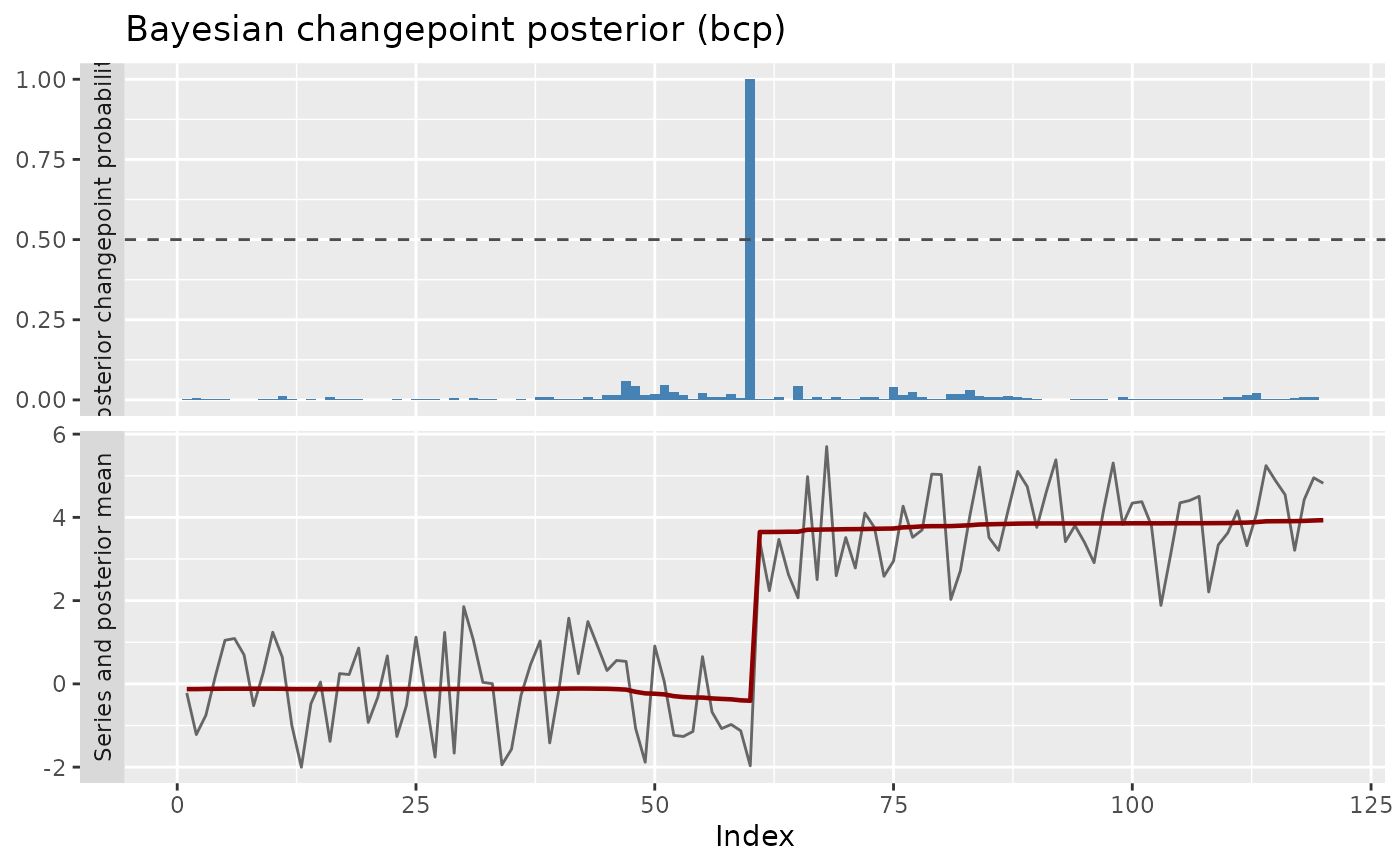
Draws the classic Bayesian changepoint display: the series with its posterior mean (top panel) and the per-location posterior probability of a changepoint (bottom panel). Works with results from bcp_wrapper() and beast_wrapper().

Usage

ggcpt_posterior(x, prob_threshold = NULL)

Arguments

x

A ggcpt object produced by a Bayesian wrapper.

prob_threshold

Probability cutoff drawn as a horizontal reference line in the probability panel; defaults to the threshold recorded on the object (or 0.5).

Value

A ggplot object (two facets sharing the x axis).

Examples

res <- bcp_wrapper(c(rnorm(60), rnorm(60, 4)), seed = 2026)
ggcpt_posterior(res)