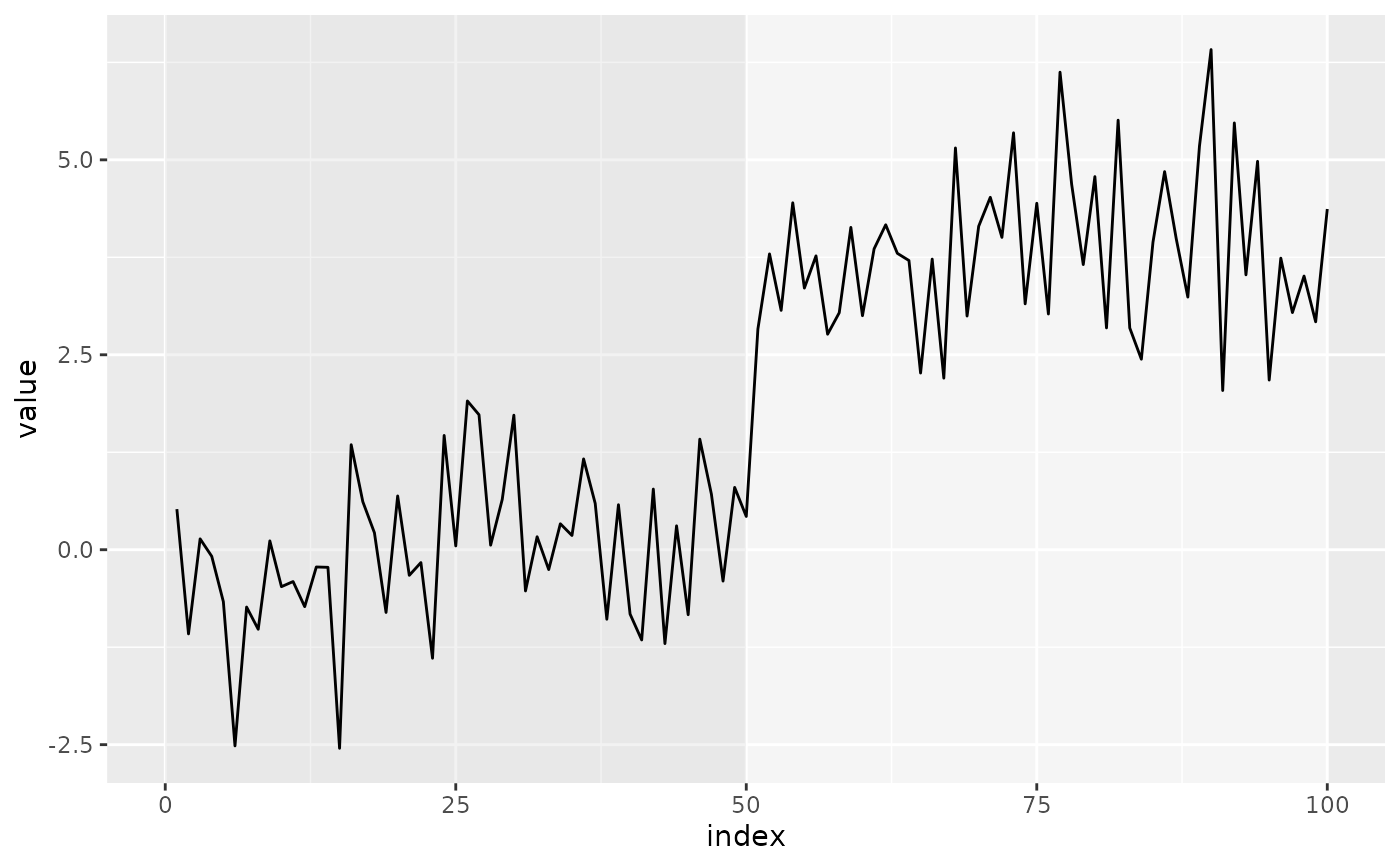
Adds alternating shaded rectangles to highlight segments between changepoints.
Usage
annotate_segments(cp, n, fill = c("grey90", "white"), alpha = 0.5, ...)See also
Other result class:
as_cpt_series(),
as_ggcpt(),
as_json(),
cpt_annotations(),
cpt_export(),
cpt_verify(),
ggchangepoint-conditions,
is_ggcpt(),
new_ggcpt(),
print.ggcpt()