
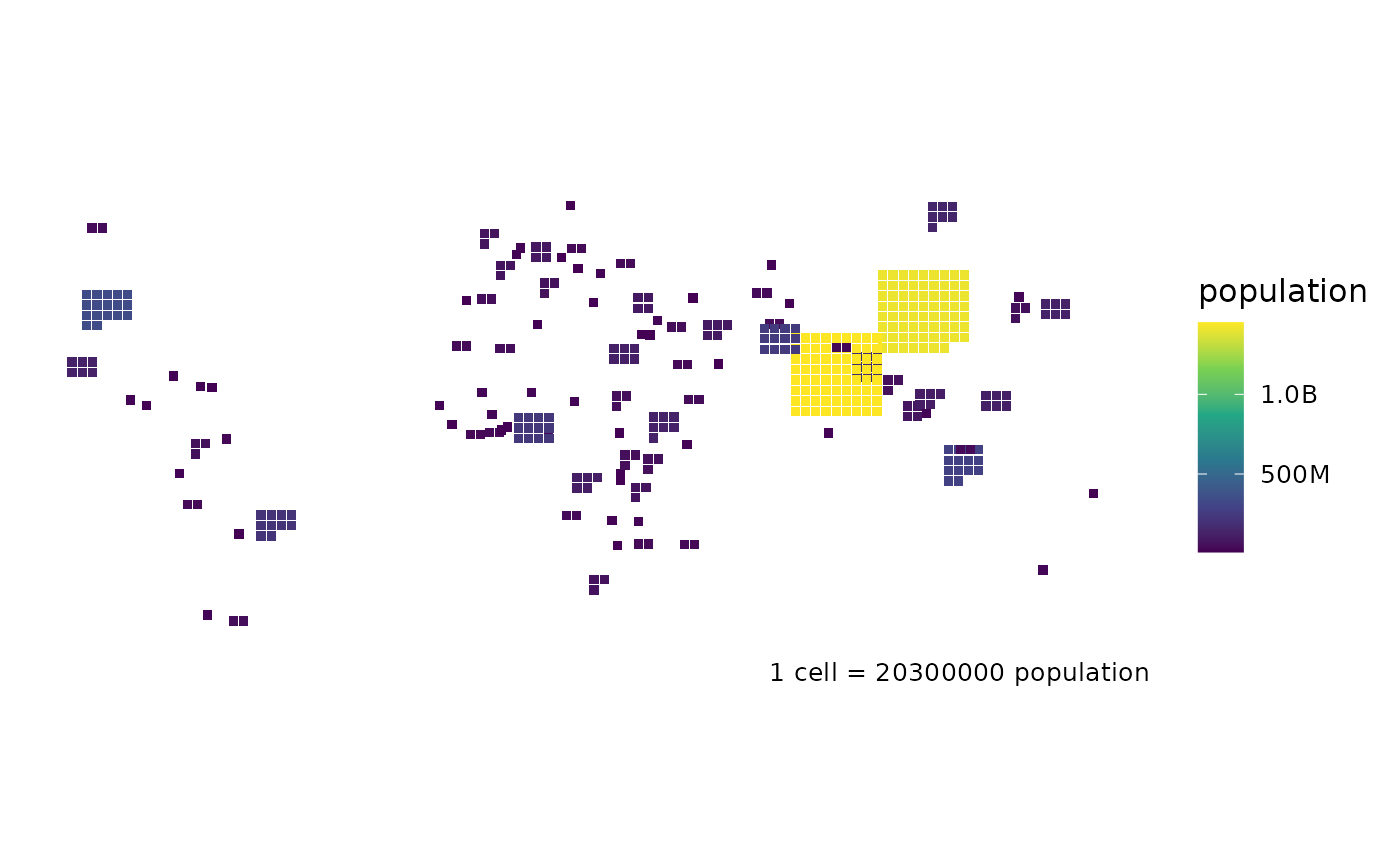
A gridded (or "waffle") cartogram: the world redrawn as equal cells, each worth a fixed quantity, allocated to countries in proportion to their value and placed near where they belong. Where a Dorling cartogram preserves position and a contiguous one preserves adjacency, this preserves countability – the reader can literally count the cells.
Usage
gridded_cartogram(
  data,
  value,
  cells = 1000,
  fill = NULL,
  cell_size = 2.5,
  projection = "equal_earth",
  footnote = "auto"
)
Arguments
- data
A country-level or map-ready frame with
iso3c.- value
The column to allocate cells by (unquoted).
- cells
Total number of cells to distribute (default
1000). Each cell is then worthsum(value) / cells.- fill
Optional fill column (unquoted); defaults to
value.- cell_size
Grid spacing in degrees of latitude (default
2.5). On a projected map the cells are laid out in the projection's own units at that ground distance (one degree is about 111 km), so every cell is the same square wherever it stands.- projection
Where the blocks are placed: a projection as in
world_map()(default"equal_earth"), or"none"for the unprojected grid of 3.0.0.- footnote
The caption, as in
world_map():"auto"(default) states the coverage and source, a string is used as given,FALSEadds nothing.
Value
A ggplot object. The per-country cell allocation is attached as the
"countryatlas_cells" attribute – every placeable country, including the
ones that rounded to zero cells, so share sums to 1 and the rounding is
fully visible.
Backend
The cells are laid out from the bundled centroids in projection (Equal
Earth by default), so it needs no geometry backend and no sf.
Rounding is the whole difficulty
Allocating a whole number of cells to each country cannot be exact, so the
remainder has to go somewhere. This uses the largest-remainder method, which
guarantees the cell total is exactly cells and that no country with a
positive value gets zero cells while a smaller one gets one. The attached
table reports each country's exact share alongside its integer allocation so
the rounding is inspectable rather than hidden.
Crowded neighbours overlap
Each country's block is centred on its own centroid, with no collision
avoidance between countries. That is deliberate – a global packing solve
would push countries away from where they belong – but it means blocks in
crowded regions are drawn on top of one another, and a partly hidden block
cannot be counted or compared. The effect is not marginal: at the defaults
(cells = 1000, cell_size = 2.5) about two fifths of the cells overlap a
cell of a different country, across some eighty countries, and it grows
with cells – at cells = 2500 it is roughly 70%.
cell_size is the lever, because it scales the tiles without moving the
centroids: dropping it to 1.5 cuts the overlap at cells = 1000 to about
a sixth of the cells. Fewer cells also helps. Where exact areas matter
more than geographic position, dorling_map() resolves collisions by
displacing circles instead.
Examples
# \donttest{
snap <- countryatlas::world_snapshot$countries
gridded_cartogram(snap, population, cells = 400)
#> Warning: 1 country has no bundled centroid and cannot be placed on the grid.
#> • "GIB"
#> ℹ Their weight is excluded, so the cells shown cover 100% of the total.
 # }
# }