Rates and small numbers
Source:vignettes/articles/rates-and-small-numbers.Rmd
rates-and-small-numbers.RmdA rate over eleven thousand people shouts as loudly as one over a
billion. Four verbs handle that: rate_check() flags it,
smooth_rates() shrinks it, rate_funnel() shows
it, value_by_alpha_map() maps it.
head(rate_check(d, deaths, population))
#> # A tibble: 6 × 6
#>   iso3c numerator denominator    rate expected_se flagged
#>   <chr>     <int>       <dbl>   <dbl>       <dbl> <lgl>
#> 1 NRU         122       11947 0.0102     0.000925 TRUE
#> 2 TUV          52        9646 0.00539    0.000748 TRUE
#> 3 PLW         164       17695 0.00927    0.000724 TRUE
#> 4 MAF         219       26129 0.00838    0.000566 TRUE
#> 5 SMR         367       33977 0.0108     0.000564 TRUE
#> 6 LIE         454       40450 0.0112     0.000527 TRUE
Empirical-Bayes smoothing pulls an unreliable rate toward the global
rate, or with method = "local_eb" toward its
neighbourhood’s:
s <- smooth_rates(d, deaths, population, method = "local_eb")
head(s[order(s$population), c("iso3c", "deaths_rate", "deaths_smoothed",
                              "deaths_shrinkage")])
#> # A tibble: 6 × 4
#>   iso3c deaths_rate deaths_smoothed deaths_shrinkage
#>   <chr>       <dbl>           <dbl>            <dbl>
#> 1 TUV       0.00539         0.00637            0.568
#> 2 NRU       0.0102          0.00831            0.423
#> 3 PLW       0.00927         0.00962            0.637
#> 4 MAF       0.00838         0.00850            0.671
#> 5 SMR       0.0108          0.00945            0.519
#> 6 MHL       0.00818         0.00764            0.423
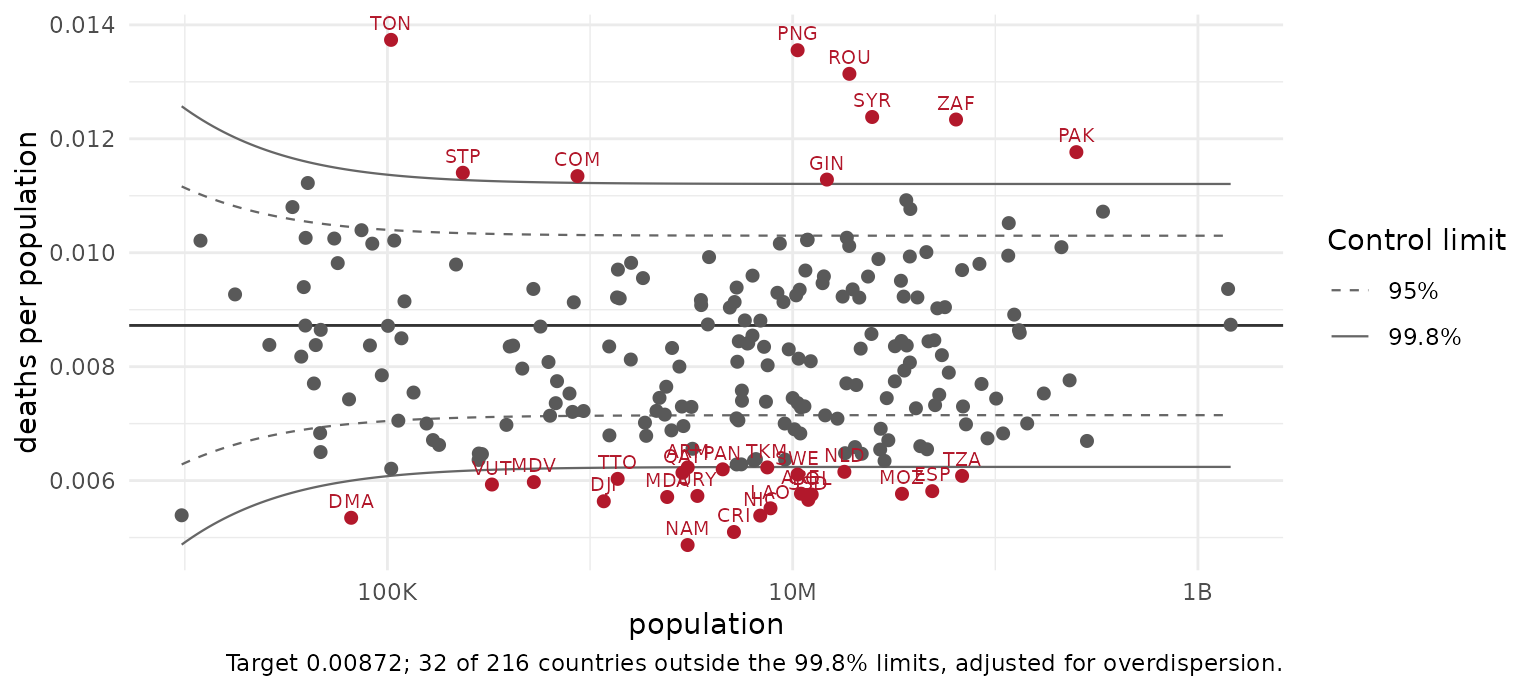
The funnel plot puts every country against the limits chance alone would give a country its size, with Spiegelhalter’s overdispersion adjustment:
rate_funnel(d, deaths, population, overdispersion = TRUE)