
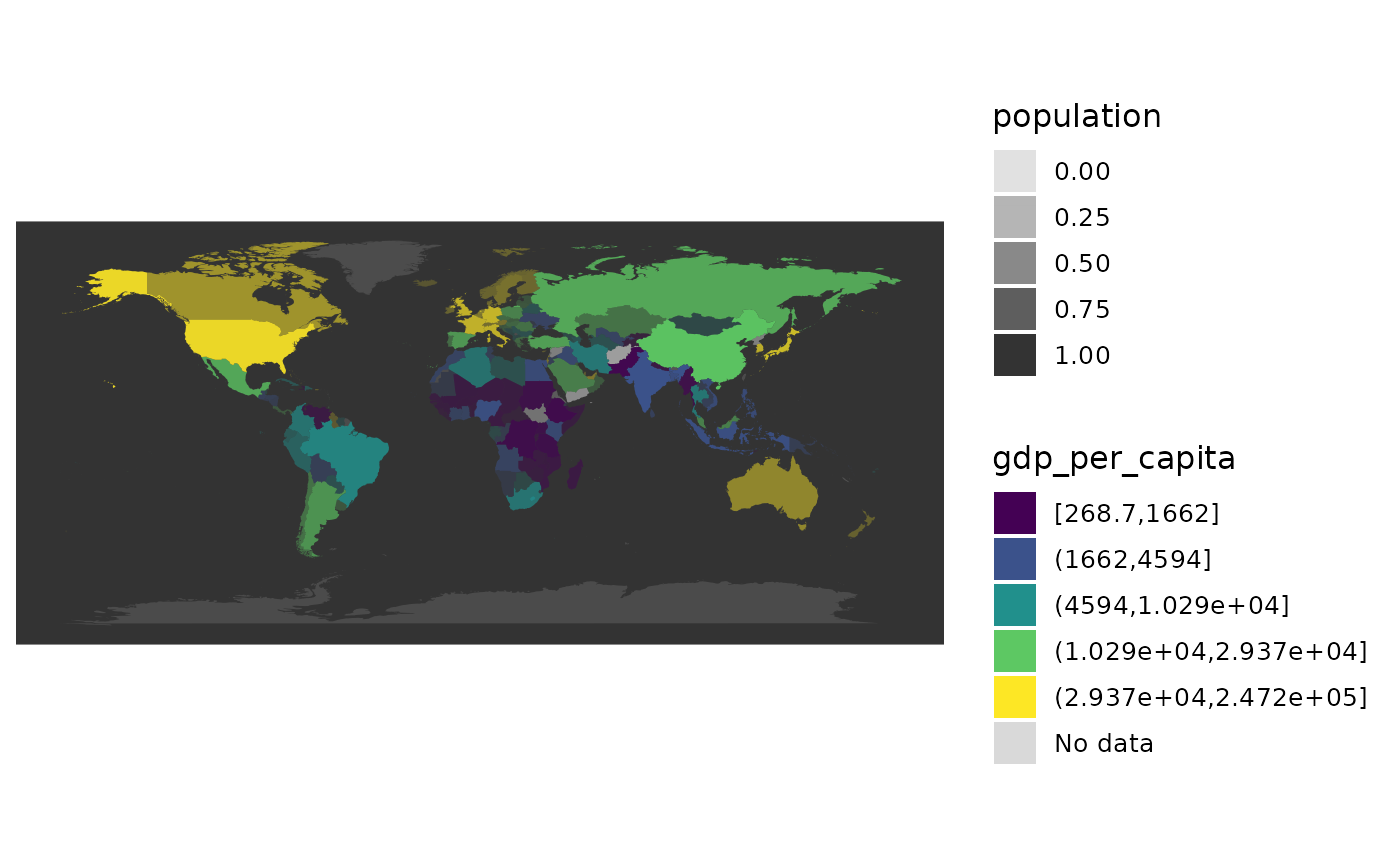
A choropleth where colour carries the value and opacity carries an equalising variable (usually population), over a neutral background. It is the answer to the small-number problem – a rate computed over eleven thousand people shouts as loudly as one computed over a billion – and unlike a cartogram it solves it without distorting geometry, which is the main objection to cartograms. Roth, Woodruff & Johnson (2010) introduced it for exactly this purpose.
Usage
value_by_alpha_map(
  data,
  value,
  equalize,
  style = c("quantile", "continuous", "binned", "equal", "jenks", "fisher", "headtails",
    "sd", "fixed"),
  palette = NULL,
  n_bins = 5,
  breaks = NULL,
  midpoint = NULL,
  alpha_range = c(0.15, 1),
  transform = c("rank", "log10", "identity"),
  background = "grey20",
  title = NULL,
  legend = NULL,
  projection = "equal_earth",
  footnote = "auto",
  small_states = c("auto", "none", "dots"),
  small_area_km2 = 1000
)
Arguments
- data
A map-ready frame (polygon or
sf).- value
The value column, carried by colour (unquoted).
- equalize
The equalising column, carried by opacity (unquoted) – population, total counts, or whatever denominator the rate was built on.
- style
Classification for the colour channel, as in
world_map()(any of its styles but"categorical").- palette, breaks, midpoint
As in
world_map().- n_bins
Number of colour bins for the binned styles.
- alpha_range
Minimum and maximum opacity (default
c(0.15, 1)).- transform
Transform applied to
equalizebefore it is mapped to opacity:"rank"(default, robust to the extreme skew of population),"log10"or"identity".- background
Colour behind the countries, which shows through where opacity is low (default a dark neutral).
- title, legend
Optional plot title and legend title.
- projection
Projection, as in
world_map().- footnote, small_states, small_area_km2
As in
world_map(). A small state drawn as a point takes its opacity fromequalizetoo.
Backend
Either backend, from the frame: an sf frame draws through coord_sf(), a
polygon frame on the polygon backend, both in projection (Equal Earth by
default).
References
Roth, R. E., Woodruff, A. W. & Johnson, Z. F. (2010). Value-by-alpha maps: an alternative technique to the cartogram. The Cartographic Journal 47(2), 130-140. doi:10.1179/000870409X12488753453372
See also
cartogram_map() and dorling_map() (the geometry-distorting
answers to the same problem), world_map()
Examples
# \donttest{
snap <- countryatlas::world_snapshot$countries
attach_geometry(snap, geometry = "polygon") |>
value_by_alpha_map(gdp_per_capita, population)
 # }
# }