
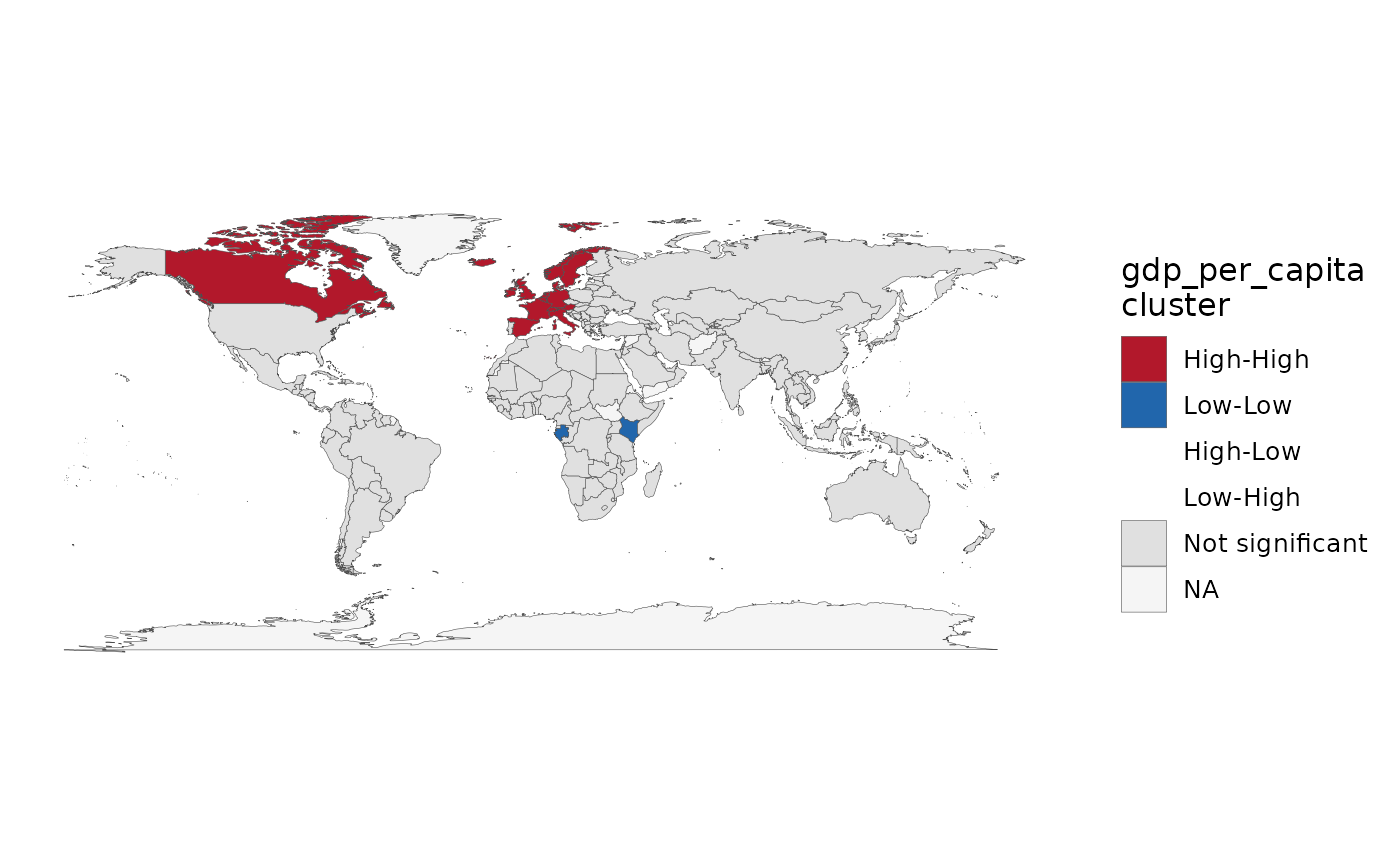
The map of local_morans(): countries coloured by cluster type, with
non-significant ones left neutral. Hot spots (High-High) and cold spots
(Low-Low) read immediately; the off-diagonal categories are the spatial
outliers.
Usage
lisa_map(
  data,
  value,
  weights = NULL,
  n_perm = 9999,
  alpha = 0.05,
  p_adjust = c("fdr", "bonferroni", "holm", "none"),
  ...
)
Arguments
- data
A map-ready frame (polygon or
sf) withiso3c.- value
The value column (unquoted).
- weights
A
country_weights()object;NULL(default) iscountry_weights("knn", k = 5), as inlocal_morans().- n_perm, alpha, p_adjust
Passed to
local_morans(). The significance mask uses the adjusted p-values, and the caption names the method.- ...
Passed to
world_map().
Value
A ggplot object, with the local_morans() table attached as the
"countryatlas_lisa" attribute.
Backend
Either backend, as world_map(): the frame decides, and both draw in Equal
Earth unless projection is passed on through ....
Examples
# \donttest{
snap <- countryatlas::world_snapshot$countries
set.seed(1)
attach_geometry(snap, geometry = "polygon") |>
lisa_map(gdp_per_capita, weights = country_weights("knn", k = 5),
n_perm = 99)
 # }
# }