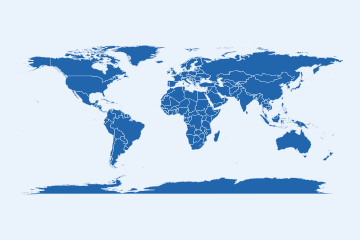
world_map_ui() and world_map_server() put world_map() in a Shiny app:
a fill column, a classification, the number of classes and a projection to
choose from, and the map with its coverage caption and its alt text, which
a screen reader announces. The server returns the map as a reactive, so the
app can reuse it (a download button, a second view).
Usage
world_map_ui(
  id,
  style = "quantile",
  projection = "equal_earth",
  n_bins = 5,
  height = "480px"
)

world_map_server(id, data, fill = NULL, ...)
Arguments
- id
The module id, the same string in both calls.
- style, projection, n_bins
The initial classification, projection and number of classes; the user can change all three.
- height
The map's height, any CSS unit (default
"480px").- data
The data to map: a frame with map geometry (see
attach_geometry()), or one row per country with aniso3ccolumn, which gets the bundled polygons attached once. A reactive returning either also works, for data the app filters.- fill
The column selected first, as a string.
NULL(the default) selects the first numeric column.- ...
Passed to
world_map(), for examplepalette,titleorfootnote. The four arguments the inputs control (fill,style,projectionandn_bins) are not accepted here.
Value
world_map_ui() returns a shiny::tagList() of the inputs and the
plot output. world_map_server() returns a shiny::reactive() holding the
current map, a ggplot.
Examples
if (interactive() && requireNamespace("shiny", quietly = TRUE)) {
  ui <- shiny::fluidPage(world_map_ui("map"))
  server <- function(input, output, session) {
    world_map_server("map", world_snapshot$countries, fill = "gdp_per_capita")
  }
  shiny::shinyApp(ui, server)
}