
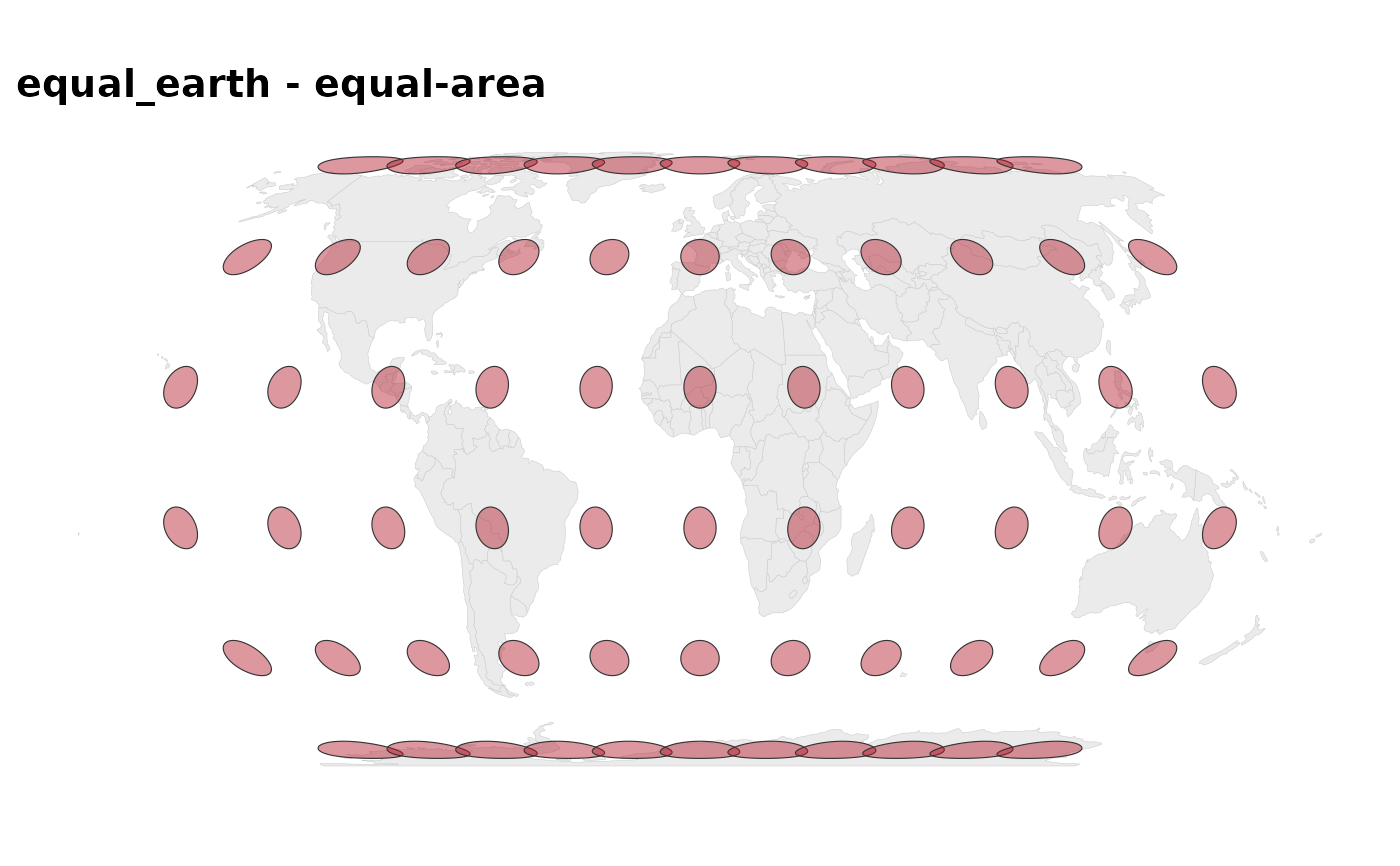
Draws Tissot indicatrices – small circles of equal ground radius, placed on a graticule and projected with everything else. On an equal-area projection every ellipse encloses the same area (though shapes shear); on a conformal projection every ellipse stays circular but sizes explode. It is the standard cartographic device for showing what a projection costs, and it makes the package's "honest maps" claim visible instead of asserted.
Usage
tissot_map(
  projection = "equal_earth",
  spacing = 30,
  radius_km = 500,
  max_lat = 75,
  fill = "#B2182B",
  color = "grey20"
)
Arguments
- projection
Projection to illustrate (see
projection_info()).- spacing
Degrees between indicatrices (default
30).- radius_km
Ground radius of each circle in kilometres (default
500).- max_lat
Absolute latitude limit for the circle centres (default
75; the poles are singular in most projections).- fill, color
Fill and outline colour for the ellipses.
Examples
# \donttest{
if (requireNamespace("sf", quietly = TRUE) &&
requireNamespace("rnaturalearth", quietly = TRUE)) {
tissot_map("mercator") # circles stay round, and grow enormously
tissot_map("equal_earth") # equal areas, sheared shapes
}
 # }
# }