
Which emoji are used together is a network question, and
emoji_pairs() returns exactly the edge list a network
package wants. The trap is that the edge list it returns by default is
mostly noise, and a layout draws noise as confidently as it draws
structure. This article builds an emoji network that is worth drawing:
weighted by an association measure, thresholded on frequency, and
checked against what the emoji-network literature says such networks
look like.
library(tidyEmoji)
library(dplyr)

# the example corpus: 1,485 OASST2 messages, about half carrying emoji
posts <- oasst_messages
Counts first, and why they are not enough
One row per pair of distinct emoji that appear in the same message, with the number of messages in which they do:
edges <- posts %>% emoji_pairs(text)
edges
#> # A tibble: 4,316 × 3
#>    item1 item2     n
#>    <chr> <chr> <int>
#>  1 🔬    🚀        4
#>  2 ☀️     ⛅        3
#>  3 ☀️     ⛈️         3
#>  4 ☀️     ❄️         3
#>  5 ☀️     🌊        3
#>  6 ☀️     🌤️         3
#>  7 ☀️     🌥️         3
#>  8 ☀️     🌦️         3
#>  9 ☀️     🌧️         3
#> 10 ☀️     🌨️         3
#> # ℹ 4,306 more rows

edges %>% count(n, name = "pairs")
#> # A tibble: 4 × 2
#>       n pairs
#>   <int> <int>
#> 1     1  4044
#> 2     2   169
#> 3     3   102
#> 4     4     1
4044 of the 4316 edges (93.7%) are a single message. A graph drawn from all of them is one message’s worth of evidence per line, and the few heavy edges belong to the emoji that are common everywhere, which pair with everything because they are common, not because they are related.
Weight by association, then threshold on frequency
Two changes fix this, and they do different jobs.
-
An association measure scores each pair against
what its two emoji’s own frequencies predict, so a common emoji no
longer wins every edge.
measure = "dice"is2 * n / (n1 + n2), withn1andn2the messages holding each emoji: 1 for a pair never seen apart, near 0 for a pair that is mostly apart."ppmi"and"log_odds"are the alternatives; see?emoji_pairs. - A frequency threshold removes the edges seen too rarely to mean anything. An association measure cannot do this on its own: a pair seen in one message, whose two emoji appear nowhere else, scores the maximum Dice of 1.
weighted <- posts %>%
  emoji_pairs(text, measure = "dice") %>%
  filter(n >= 2)

weighted
#> # A tibble: 272 × 4
#>    item1 item2     n  dice
#>    <chr> <chr> <int> <dbl>
#>  1 ⛅    ⛈️         3     1
#>  2 ⛅    ❄️         3     1
#>  3 ⛅    🌤️         3     1
#>  4 ⛅    🌥️         3     1
#>  5 ⛅    🌦️         3     1
#>  6 ⛅    🌨️         3     1
#>  7 ⛅    🌩️         3     1
#>  8 ⛅    🌫️         3     1
#>  9 ⛅    🌬️         3     1
#> 10 ⛈️     ❄️         3     1
#> # ℹ 262 more rows
That is the honest network for this corpus: 272 edges, where the raw
edge list had 4316. Most of those came from a handful of replies that
tabulate dozens of emoji at once, which pair every emoji in the table
with every other; 1,485 messages holding 1,454 emoji are too few for a
network of more than a modest number of emoji, and it is better to know
that than to draw the whole edge list. A corpus of hundreds of thousands
of messages, or one pooled by user or by conversation with
doc_id, gives a graph with real structure.
Into a network package
The edge list feeds igraph (or tidygraph)
directly, with the association measure as the edge weight:
g <- igraph::graph_from_data_frame(
  weighted[, c("item1", "item2", "dice", "n")], directed = FALSE)

igraph::vcount(g)
#> [1] 95
igraph::ecount(g)
#> [1] 272
igraph::components(g)$no
#> [1] 10
Community detection then groups emoji that are used together more than chance; Louvain with the Dice weight is a reasonable default:
set.seed(2026) # Louvain breaks ties at random; fix them for a stable answer
communities <- igraph::cluster_louvain(g, weights = igraph::E(g)$dice)
split(igraph::V(g)$name, igraph::membership(communities))
#> $`1`
#> [1] "⛅" "⛈️" "❄️" "🌤️" "🌥️" "🌦️" "🌨️" "🌩️" "🌫️" "🌊" "🌧️" "🌪️" "☀️" "☁️" "🌈"
#> [16] "🌬️"
#>
#> $`2`
#> [1] "🧟♀️" "🧟♂️"
#>
#> $`3`
#> [1] "🔴" "🏡" "🐺" "🧒🏻"
#>
#> $`4`
#> [1] "🤛" "🤜"
#>
#> $`5`
#> [1] "👨" "👩"
#>
#> $`6`
#> [1] "❌" "⭕"
#>
#> $`7`
#> [1] "🌟" "💖" "✨" "😇" "😎" "🏆" "😉" "👍" "😊" "💃" "😀" "😘" "🤗" "😳" "🙁"
#>
#> $`8`
#> [1] "👢" "🏰" "👑" "🎩" "🐈" "💰" "🔪"
#>
#> $`9`
#> [1] "😖" "😟" "😑" "😩" "😔" "😱" "😲" "😭" "😅" "😁" "🙄" "😈"
#>
#> $`10`
#> [1] "😐" "😝" "🤨" "🤩" "😞" "🤪" "😌" "😢" "🤓" "😨" "🤣" "😆" "😜" "😬" "😮"
#> [16] "😂" "😃" "🤔" "😄" "🧐" "🙃" "🤯"
#>
#> $`11`
#> [1] "😋" "😙" "😣"
#>
#> $`12`
#> [1] "🌍" "👨💻" "🔬" "🌐" "📦" "💡" "🚀" "🤖"Drawing it needs nothing beyond igraph’s own
plot(). The glyphs draw only where the graphics device has
a colour emoji font, so the labels here are the emoji’s names, given to
the best-connected emoji of each community only so they can be read; the
nodes are as large as their degree, the edges as wide as their Dice
association, and the colours are the communities:
set.seed(2026)
layout <- igraph::layout_with_fr(g, weights = igraph::E(g)$dice)
deg <- igraph::degree(g)
community <- as.integer(igraph::membership(communities))
top <- deg == stats::ave(deg, community, FUN = max) &
  !duplicated(paste(community, deg))
plot(g, layout = layout,
     vertex.label = ifelse(top, as_emoji_name(igraph::V(g)$name), NA),
     vertex.label.cex = 0.75, vertex.label.color = "black",
     vertex.label.dist = 1,
     vertex.size = 3 + 2 * sqrt(deg),
     vertex.color = community,
     edge.width = 6 * igraph::E(g)$dice, edge.color = "grey75",
     margin = 0)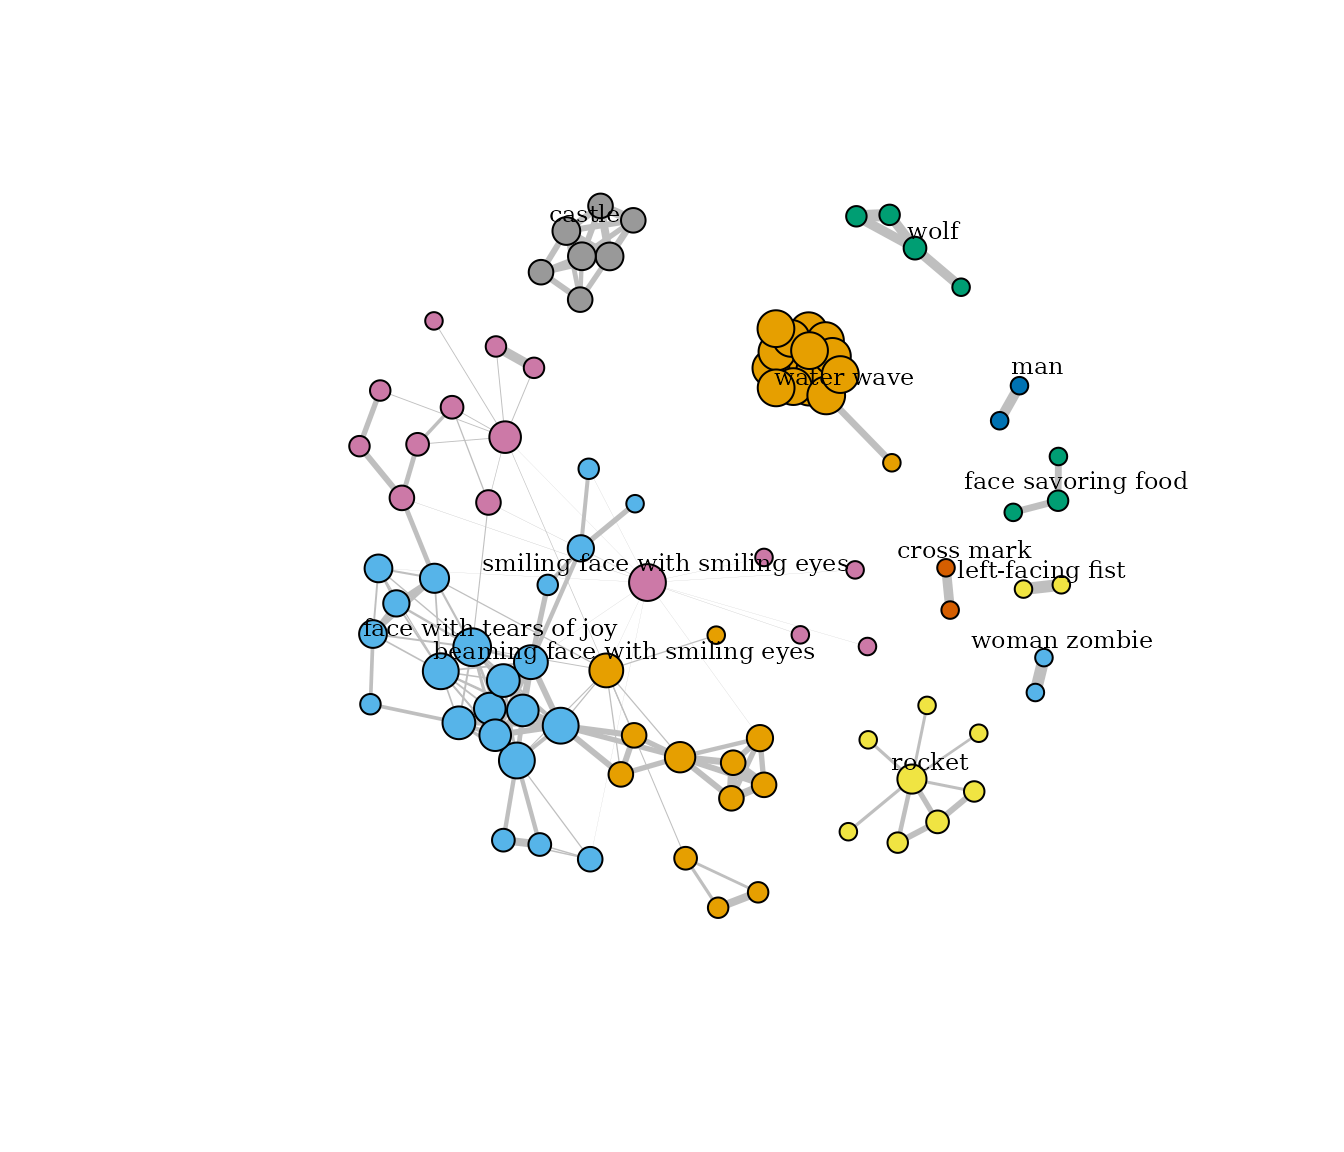
Sanity checks for a bigger corpus
Studies of emoji co-occurrence networks on large Twitter samples (Fede et al., 2018; Alsaif et al., 2021) report two properties, and both make good checks that a network is measuring structure rather than sampling noise:
- the degree distribution is heavy-tailed: a few emoji connect to very many, most connect to a few;
- most emoji fall into a handful of communities.
Both are one line once the graph exists. On a network of a dozen nodes they say little; on a real one, a degree table with no tail or a community count close to the node count is a sign that the threshold was set too low:
Directed sequences
emoji_pairs(directed = TRUE) orders each pair by first
appearance in the message, so the edge from one emoji to another counts
the messages where the first came first. The same measures apply to that
ordered event, and emoji_ngrams() gives the strictly
consecutive version for Markov-style models of emoji sequences.
References
Alsaif H, Roesch P, Othman S (2021). Analyzing Co-occurrence Networks of Emojis on Twitter. In Intelligent Computing, Springer. https://doi.org/10.1007/978-3-030-80126-7_7
Fede H, Herrera I, Mahdi Seyednezhad SM, Menezes R (2018). Representing Emoji Usage Using Directed Networks: A Twitter Case Study. In Complex Networks & Their Applications VI. https://doi.org/10.1007/978-3-319-72150-7_67