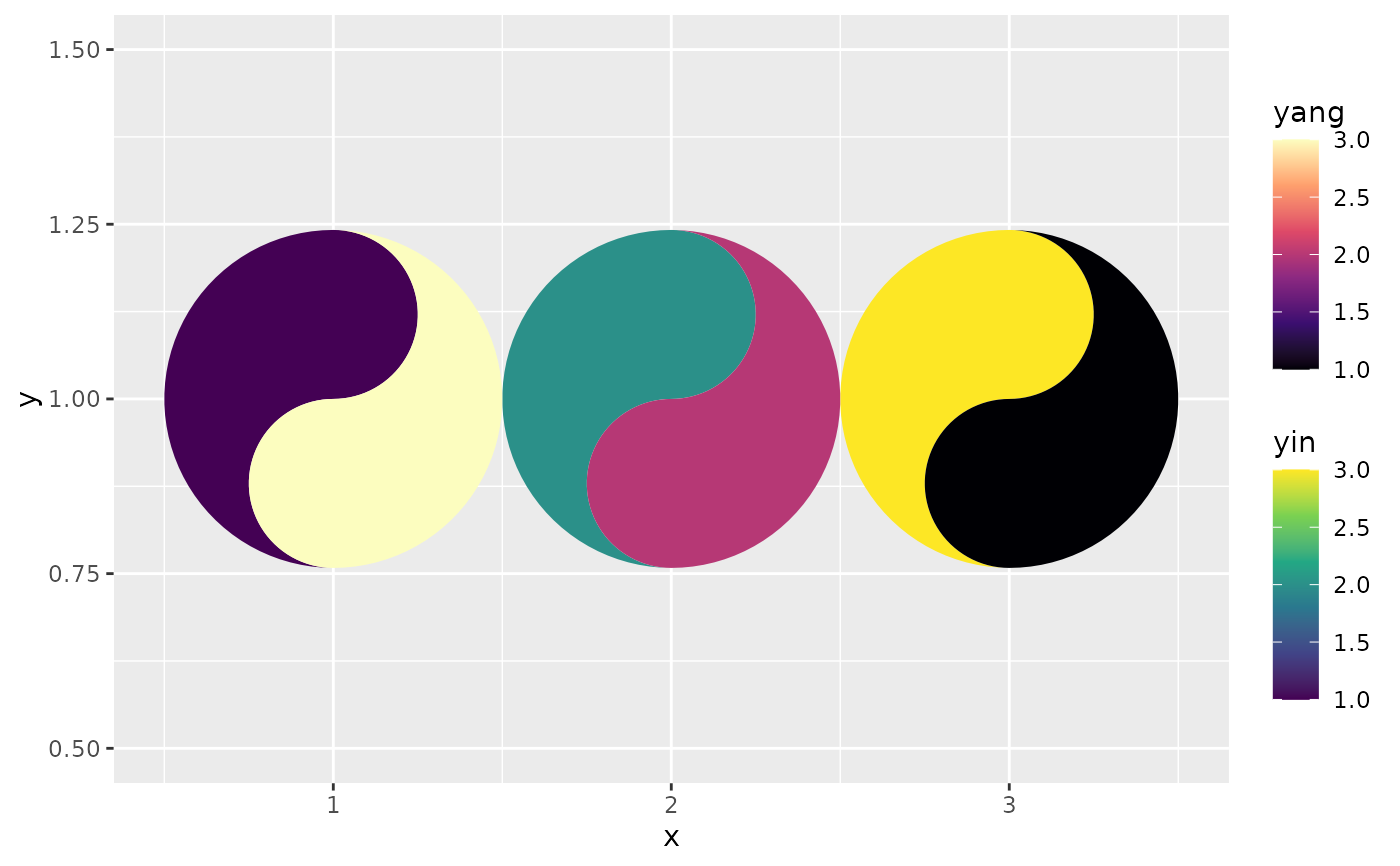
geom_yin_fish() and geom_yang_fish() each draw one of the two
interlocking fish of a taichi symbol per (x, y) cell. They are the
building blocks that geom_taichi() assembles (together with two fill
scales and a ggnewscale::new_scale_fill() break); use them directly when
you want full control: to bring your own fill scale for a single fish, to
stack scales differently, or to draw only one source.
Usage
geom_yin_fish(
  mapping = NULL,
  data = NULL,
  stat = "identity",
  position = "identity",
  width = NULL,
  height = NULL,
  eyes = FALSE,
  interactive = FALSE,
  na.rm = FALSE,
  show.legend = NA,
  inherit.aes = TRUE,
  key_glyph = NULL,
  ...
)

geom_yang_fish(
  mapping = NULL,
  data = NULL,
  stat = "identity",
  position = "identity",
  width = NULL,
  height = NULL,
  eyes = FALSE,
  interactive = FALSE,
  na.rm = FALSE,
  show.legend = NA,
  inherit.aes = TRUE,
  key_glyph = NULL,
  ...
)
Arguments
- mapping, data, stat, position, inherit.aes
See
ggplot2::layer().- width, height
Cell size; defaults to the resolution of the data.
- eyes
Logical. Draw the classic eye dot inside this fish's head?
- interactive
Logical. Draw ggiraph grobs carrying the
tooltip,data_idandonclickaesthetics, so thatggiraph::girafe()can turn the plot into a widget. Needs the ggiraph package.- na.rm
If
TRUE, silently removes rows with missing positions; a missingfillis drawn in the scale'sna.valueinstead.- show.legend
Logical. Should this layer be included in the legends?
- key_glyph
Legend key glyph; defaults to this fish's half of a taichi symbol (see
draw_key_taichi()). Passed toggplot2::layer().- ...
Other arguments passed to
ggplot2::layer(): either aesthetics used as constant parameters (e.g.eye_size = 0.2) or geom parameters.
Details
Both geoms understand the aesthetics x, y, fill, colour,
linewidth, linetype, alpha, width, height, angle (degrees,
counter-clockwise), radius (a proportion of the cell's own radius, so
0.5 draws a half-size glyph in the same cell), border (a per-cell
outline width in mm, overriding linewidth), eye_size, and
eye_colour (the latter two only matter when eyes = TRUE), plus
tooltip, data_id and onclick, which are only read when
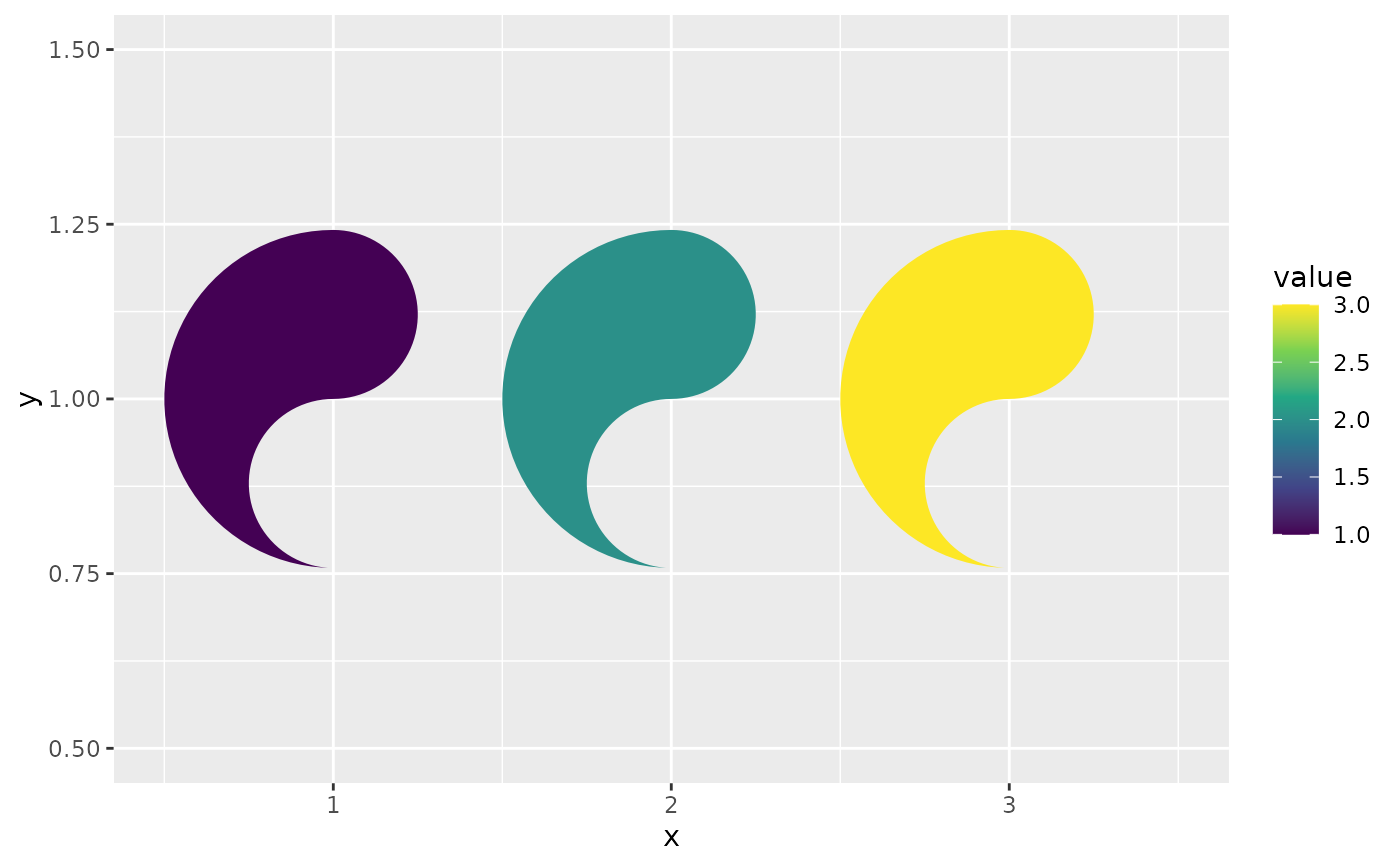
interactive = TRUE. At angle = 0 the yin fish is the left half of the
circle plus the top bulb (its head); the yang fish is the right half plus
the bottom bulb.
Examples
library(ggplot2)
d <- data.frame(x = 1:3, y = 1, value = 1:3)
# a yin-only plot with an ordinary fill scale
ggplot(d, aes(x, y)) +
geom_yin_fish(aes(fill = value)) +
scale_fill_viridis_c()
 # both fish, manually stacked with ggnewscale
ggplot(d, aes(x, y)) +
geom_yin_fish(aes(fill = value)) +
scale_fill_viridis_c(name = "yin") +
ggnewscale::new_scale_fill() +
geom_yang_fish(aes(fill = rev(value))) +
scale_fill_viridis_c(name = "yang", option = "magma")
# both fish, manually stacked with ggnewscale
ggplot(d, aes(x, y)) +
geom_yin_fish(aes(fill = value)) +
scale_fill_viridis_c(name = "yin") +
ggnewscale::new_scale_fill() +
geom_yang_fish(aes(fill = rev(value))) +
scale_fill_viridis_c(name = "yang", option = "magma")